
11
Data Handling
Favourite Colours
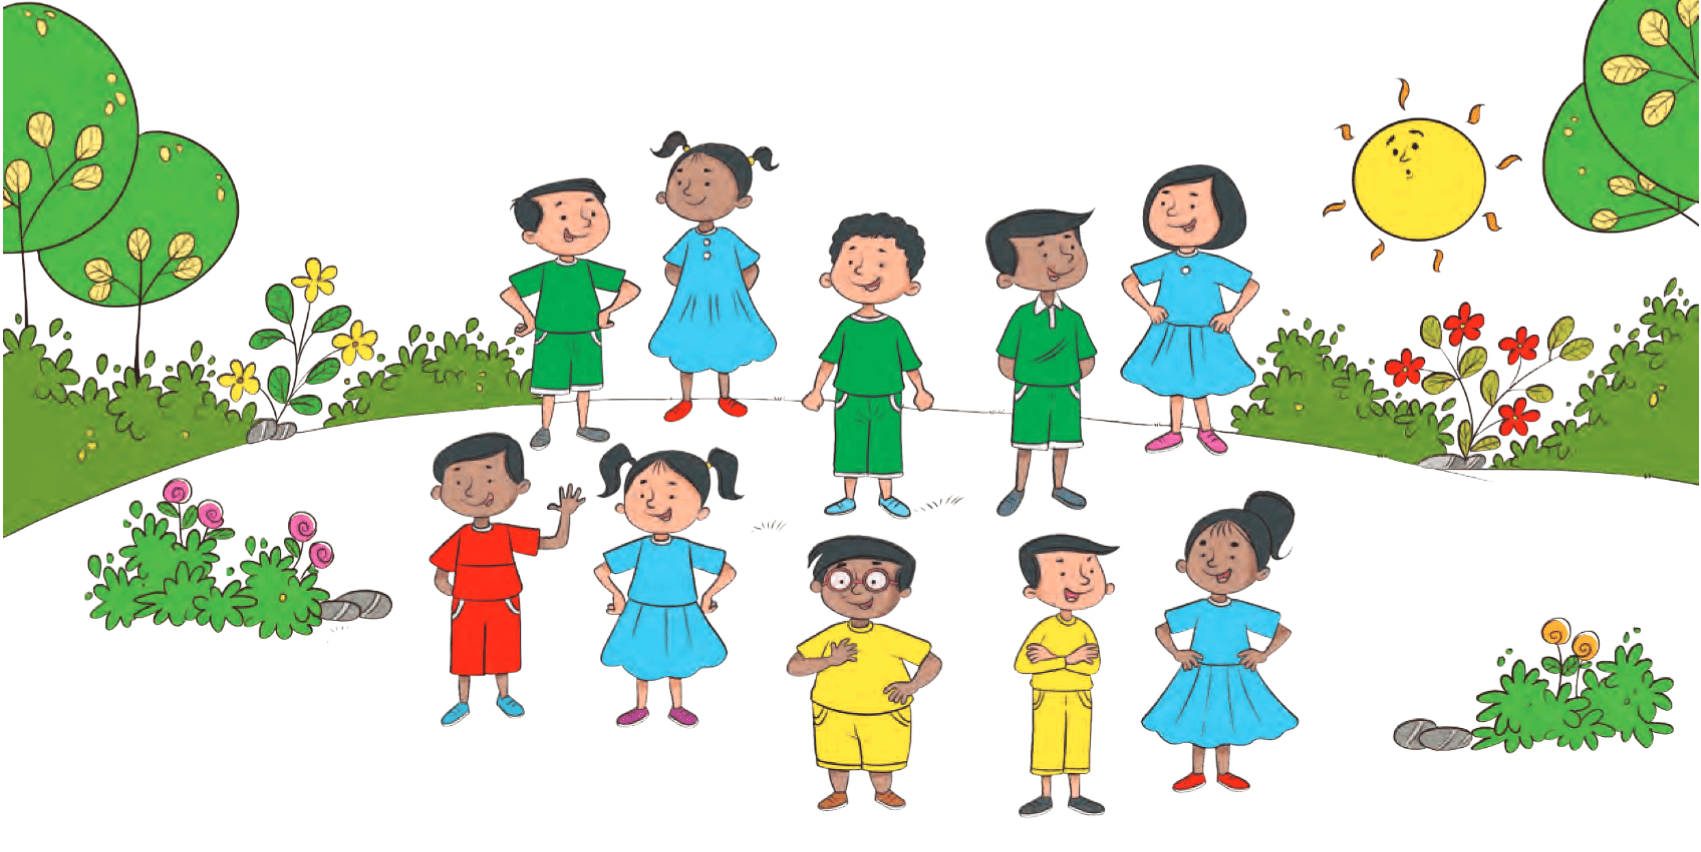
Let us Do
Look at the picture. Complete the table and fill in the blanks.
| Colours | Red | Green | Blue | Yellow |
|---|---|---|---|---|
| Number of Children |
A. The most liked colour is .
B. The least liked colour is .
C. Yellow colour is liked more than .
D. colour is liked more than green.
E. colour is liked less than .
Picnic Day
Children are having a fruit party. They are eating their favourite fruits.
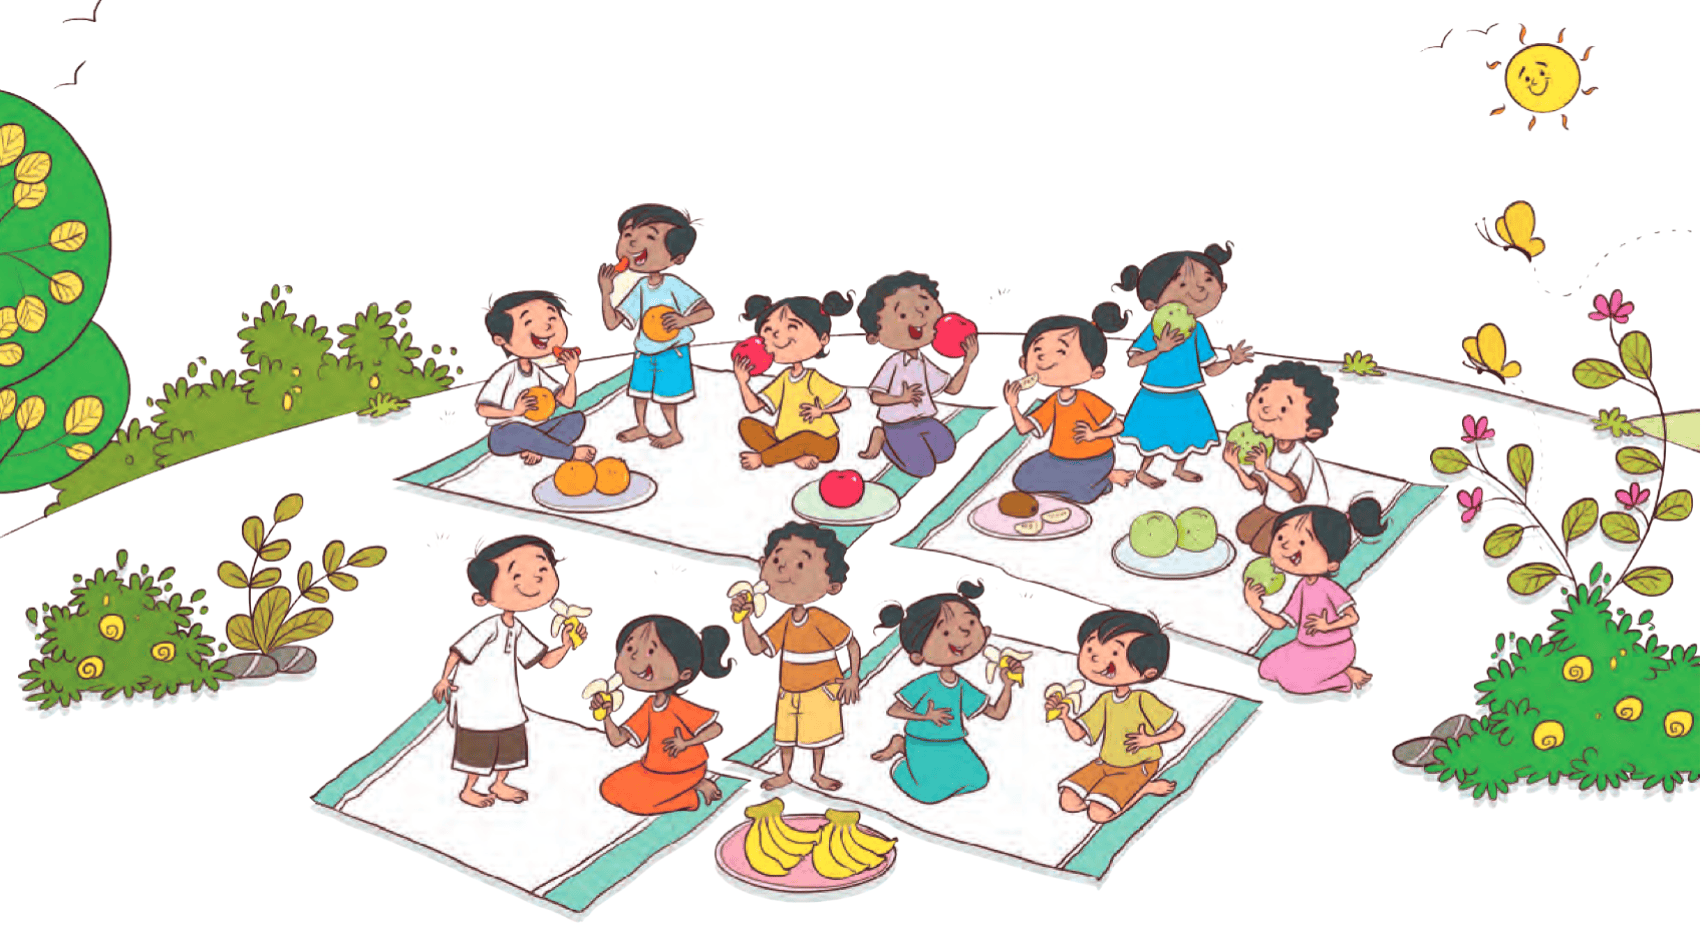
Let us Do
Complete the table and fill in the blanks.
| Fruits |  |
 |
 |
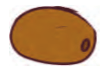 |
 |
|---|---|---|---|---|---|
| Number of Children |
A. How many children are there in the picture? .
B. Number of children who like apples is .
C. Most liked fruit is .
D. Least liked fruit is .
E. Number of children who like guava is (more than/less than/equal to) the number of children who like apple.
F. The number of children who like apple is (more than/less than/equal to) the number of children who like banana.
G. The number of children who like orange (more than/less than/equal to) the number of children who like kiwi.
Discuss the picture and fill the table.
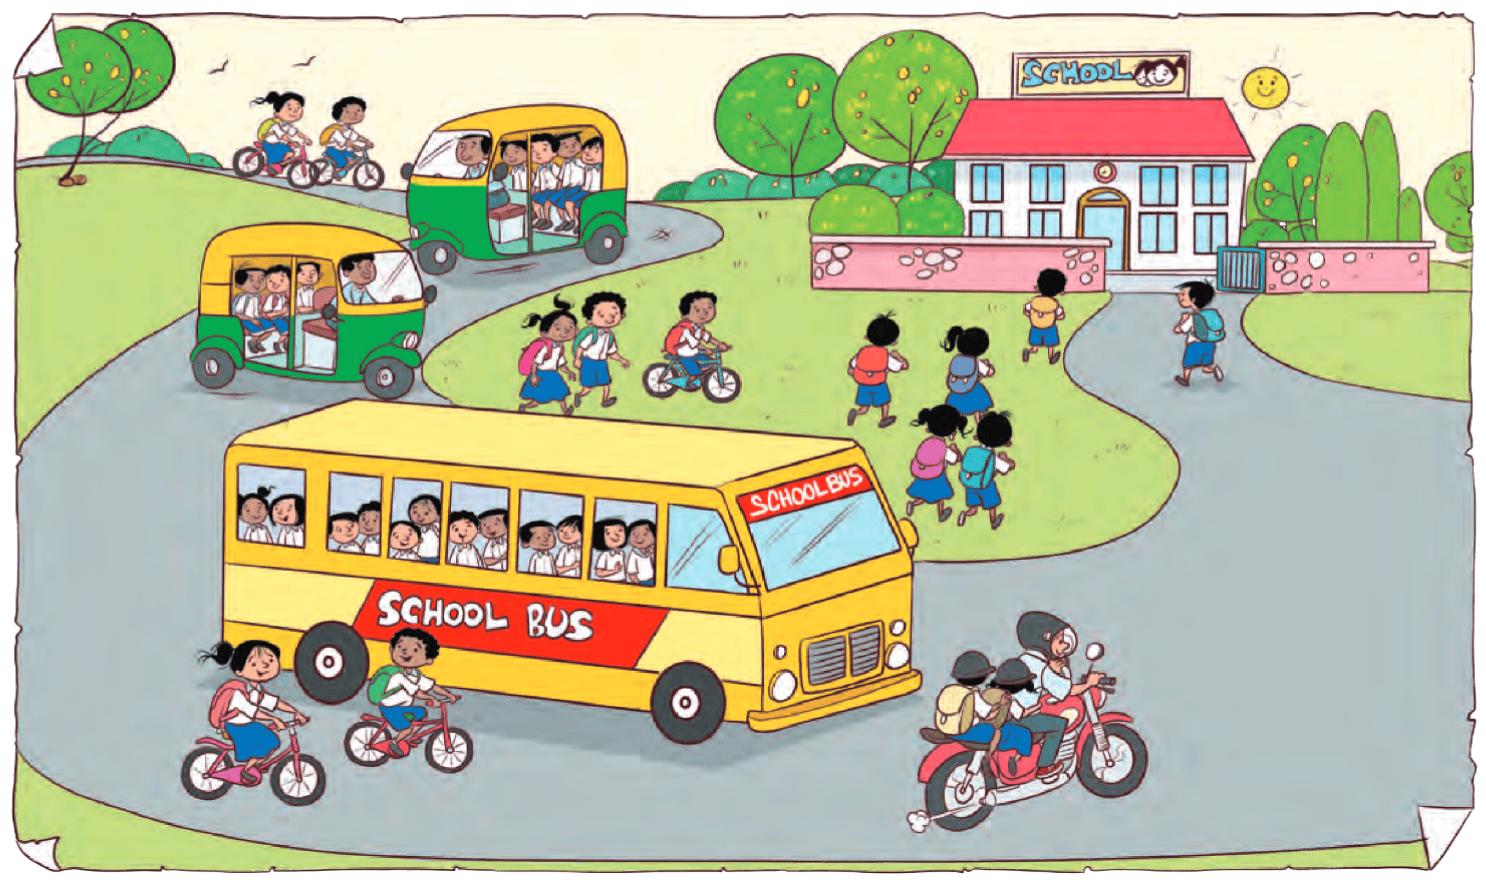
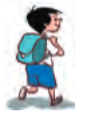
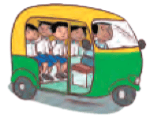
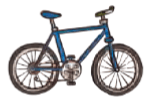
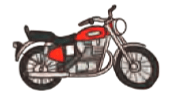
| Mode of coming to school | Number of students |
|---|---|
 |
|
 |
|
 |
|
 |
|
 |
Read the table and draw faces ( ) in the chart given
below to show the number of students coming to school
by different modes. ( = 1 student)
) in the chart given
below to show the number of students coming to school
by different modes. ( = 1 student)
Look at the chart and fill in the blanks.
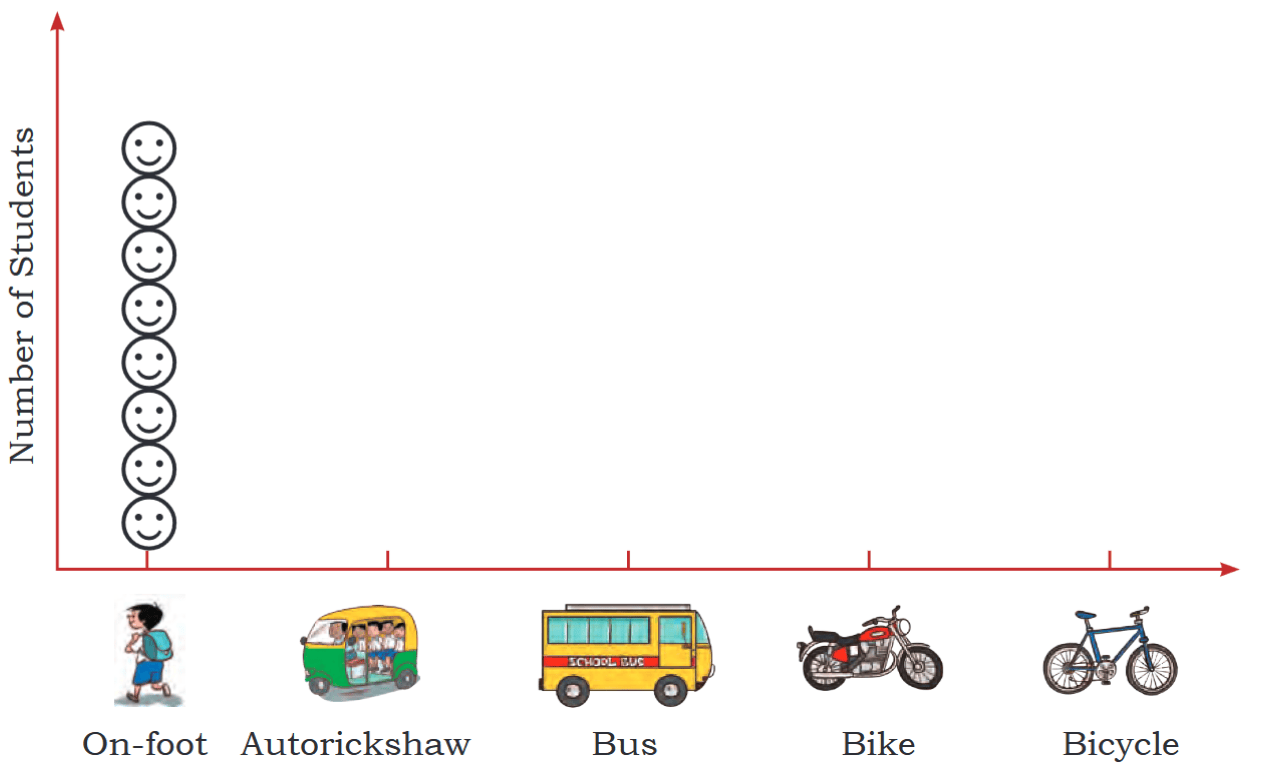
On-foot, Autorickshaw, Bus, Bike, Bicycle
A. Most number of students come to school by .
B. Least number of students come to school by .
C. The number of students who come to school using bus is (less/more) than the number of students who come using autorickshaw.
D. The number of students who come to school using bike is (more/less) than the number of students who come using bicycle.
E. The number of students who come to school using is less than the number of students who come using .
F. The number of students who come to school using is more than the number of students who come using .
Let us Do
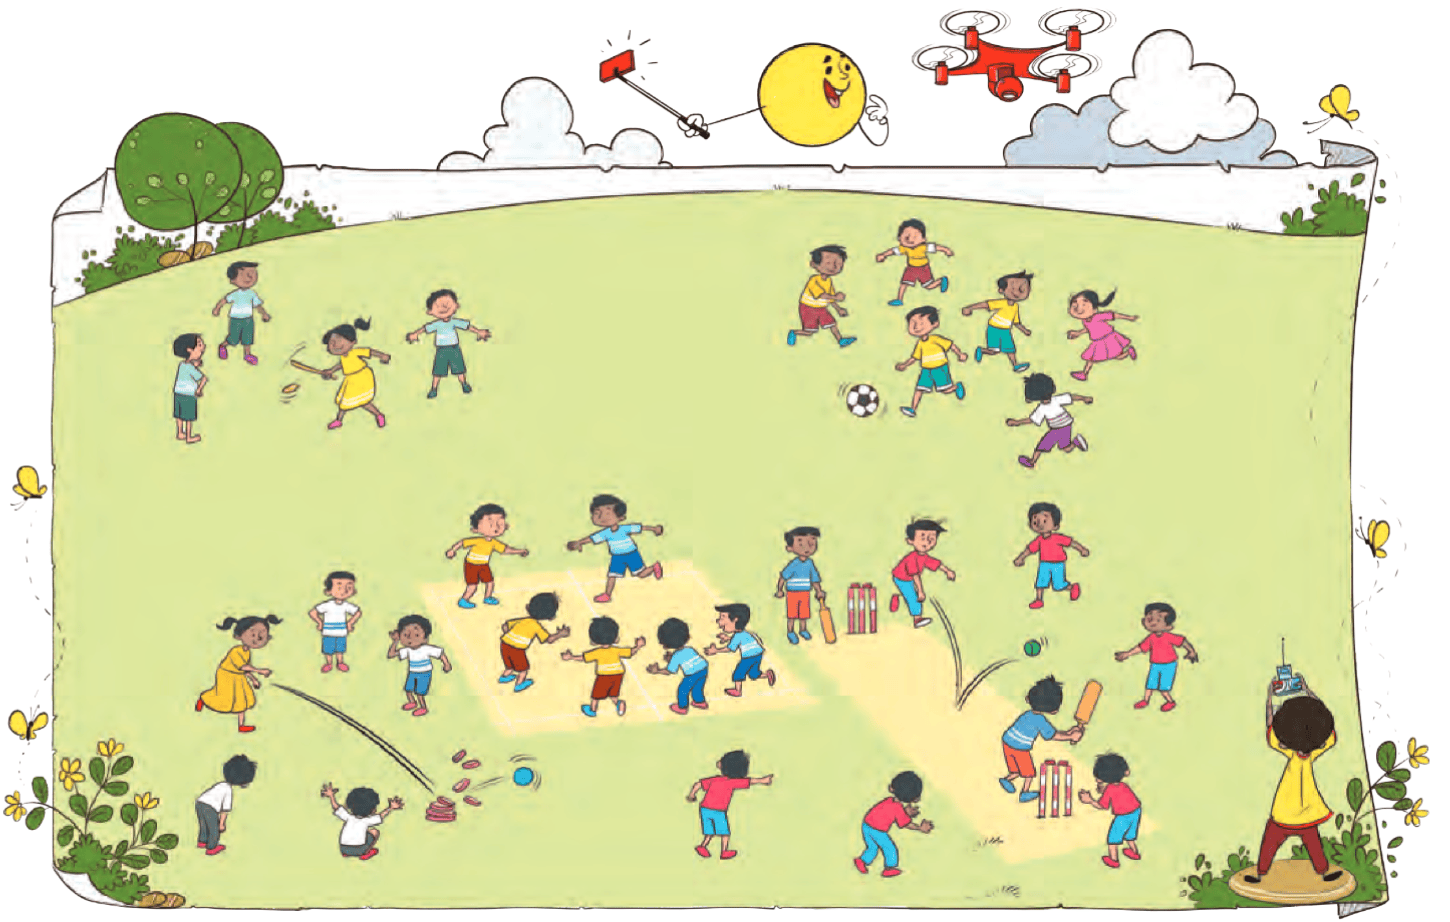
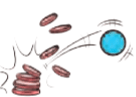
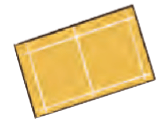
Look at the picture and fill the table.
| Games | Number of Students |
|---|---|
 |
|
 |
|
 |
|
 |
|
 |
Use the table to draw faces () to show the number of
students in the chart below.
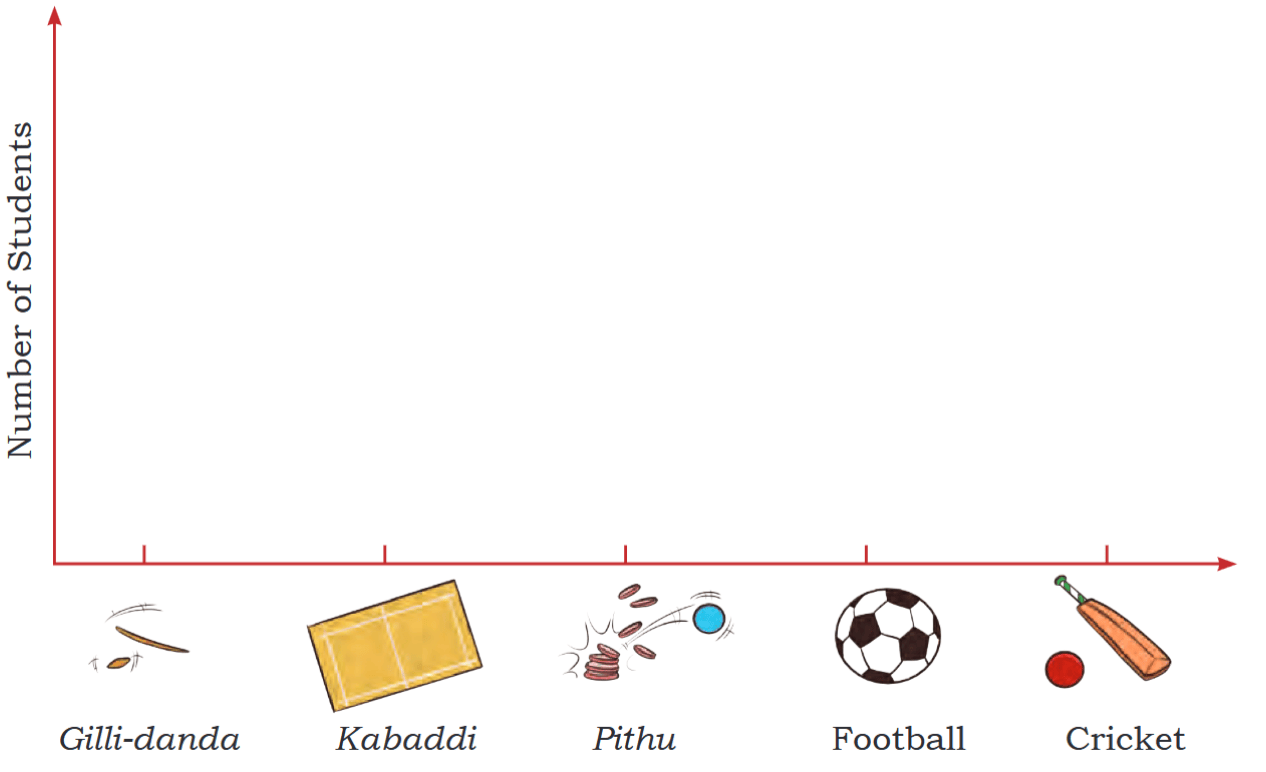
Gilli-danda Kabaddi Pithu Football Cricket
A. The most liked game is .
B. The least liked game is .
C. Pithu is liked more than .
D. is liked more than football.
Let us Do
A. Discuss in your class and ask your friends about the vegetables they like the most. Complete the table.
| Vegetable they like | |||||
|---|---|---|---|---|---|
| Number of children |
B. Read the table and fill in the blanks.
i. Most liked vegetable is .
ii. Least liked vegetable is .
iii. is liked more than .
iv. is liked less than .
C. Ask your friends about the number of family members living in their homes. Fill in the table given below.
i. Most families have people in their homes.
ii. The least number of people living in a home is .
iii. The number of families having 4 people is .
iv. The number of families having more than 4 people is .
| Number of people living together | How many families |
|---|---|
| 1 People | |
| 2 People | |
| 3 People | |
| 4 People | |
| 5 People | |
Project Work
Visit nearby families to find out the number of families which have their grandparents living with them. Record the information to fill in the table.

How many families did you visit?
Number of families living with both grandparents
How many families live with one grandparent?
How many families live without grandparents?
Before visiting the families, discuss the questions you are going to ask them in the class.