Chapter-15
Data Through Pictures

Child TV Reporter
Samaira and Kabir decided to act like reporters and collect information from their friends.
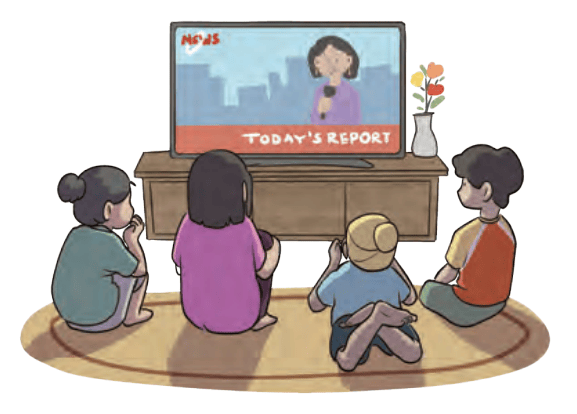
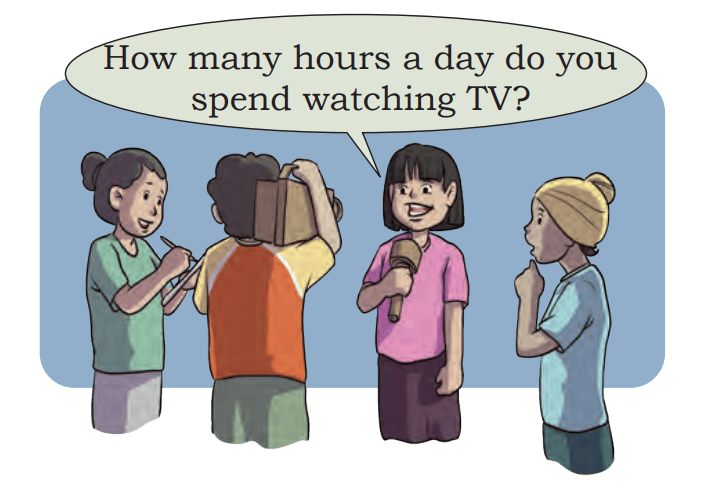
- How many hours a day do you spend watching TV?
They collected data from 35 friends and recorded it in a notebook as shown below.
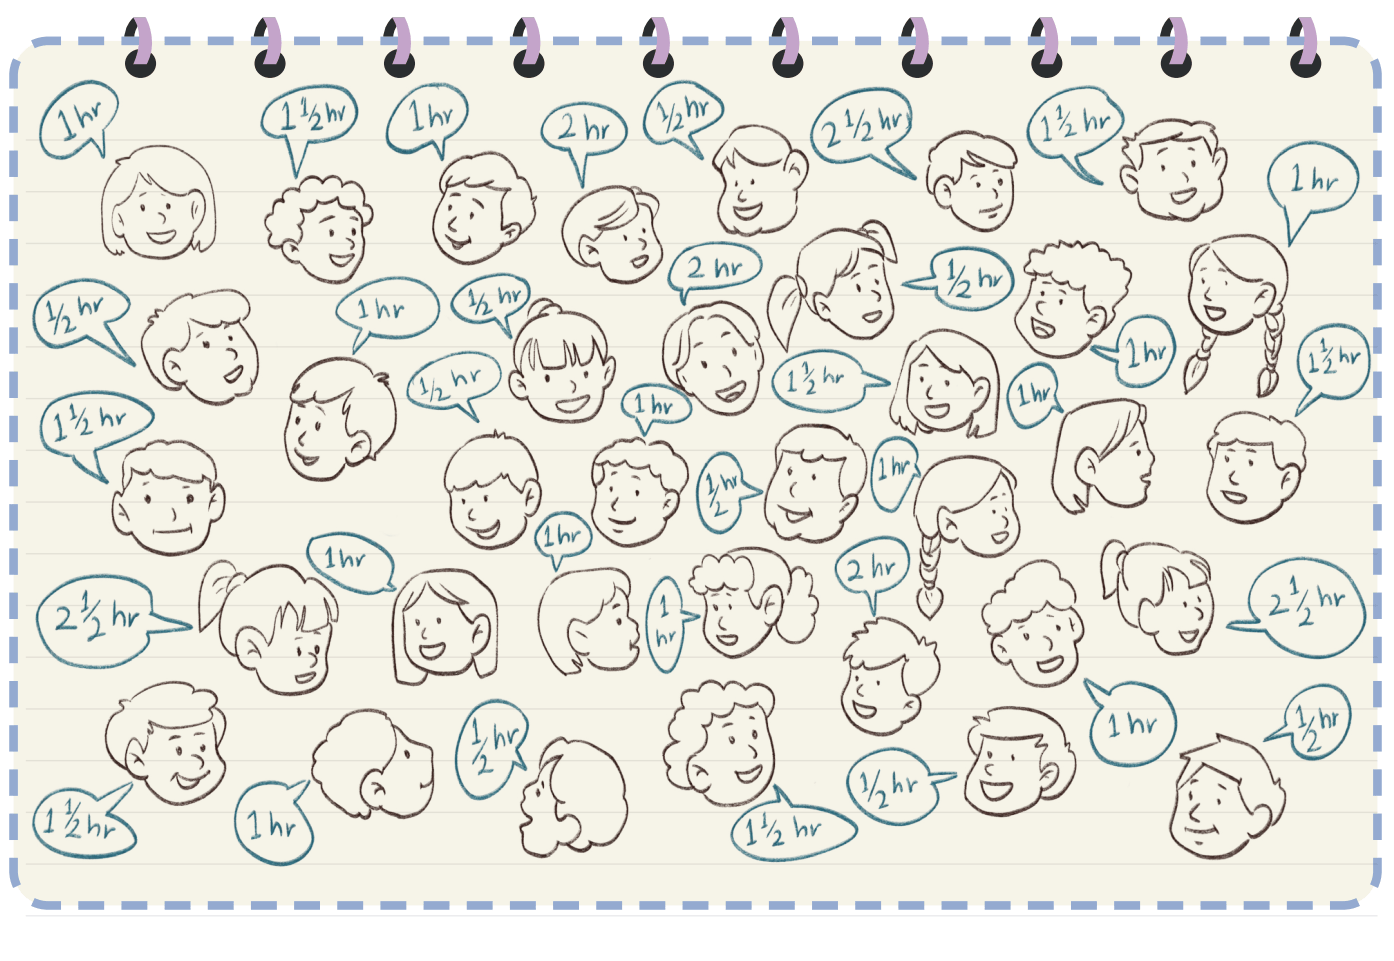
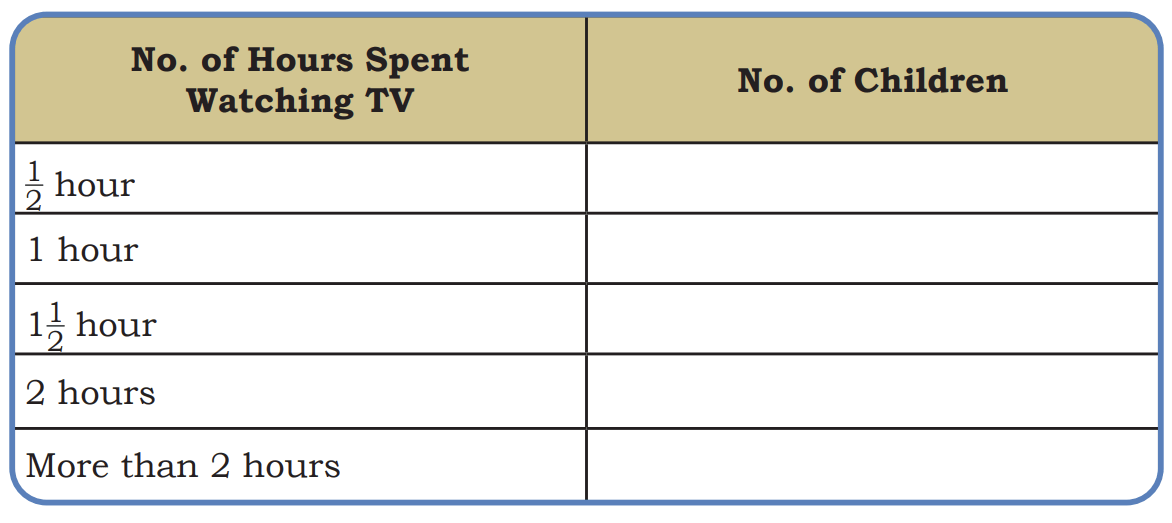
Look at the table and answer the following questions.
- How many children watch TV for more than half an hour?
- How many children watch TV for less than two hours?
- The number of children who watch TV for more than two hours is ________.
- More children watch TV for two hours than half an hour. (True/False)
- Can watching TV for a long time be harmful to the eyes?
Stock-Taking in a Shop
Joseph Uncle takes stock of the play items (toys, board games, and sports items) in his store a week before the summer break. He tries to record the items in his shop using a pictograph.
- How can I show these with pictures?
He notices that there are too many items of each kind in his shop and it is not easy to make a picture for every item.

Dipesh, one of his helpers, suggested using one picture (icon) for every 5 items of each kind.
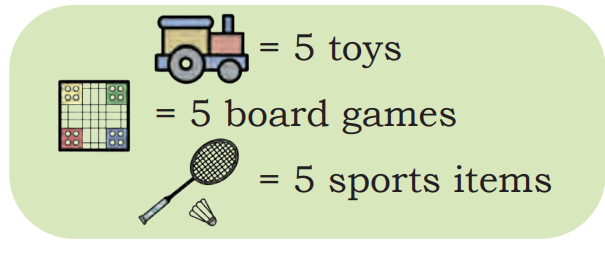
His pictograph is shown below.
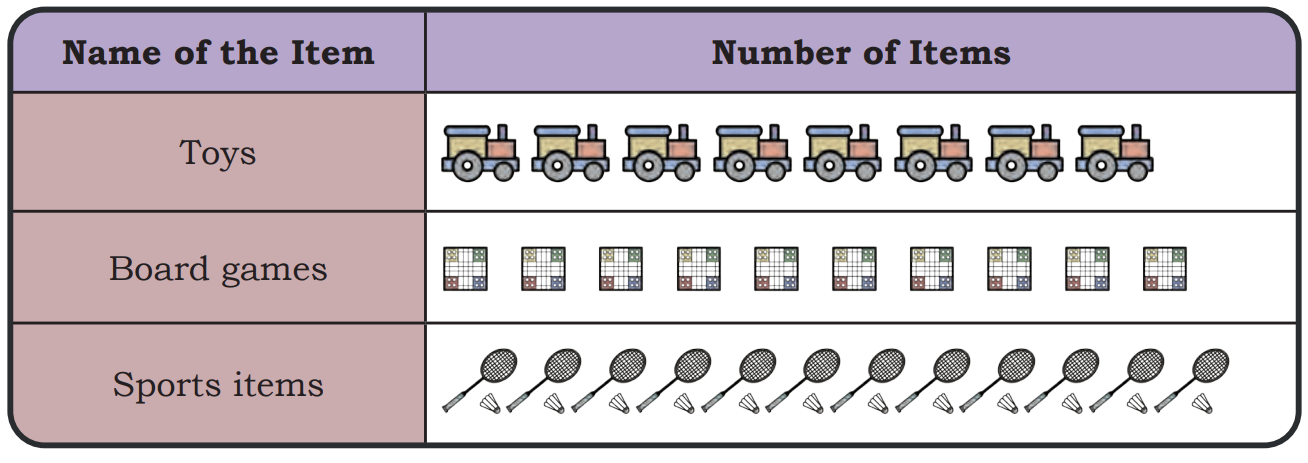
Dipesh used a scale while recording the items in the pictograph. A scale helps record a large number of things using fewer icons.
Now, answer the following questions based on the above pictograph.
- How many toys does Joseph Uncle have? __________
- How many board games does Joseph Uncle have? __________
- How many total play items does Joseph Uncle have? __________
Is there any other scale that you can use to make the pictograph? Choose your scale and show the same data using a pictograph in your notebook.
Two-wheelers on the Road
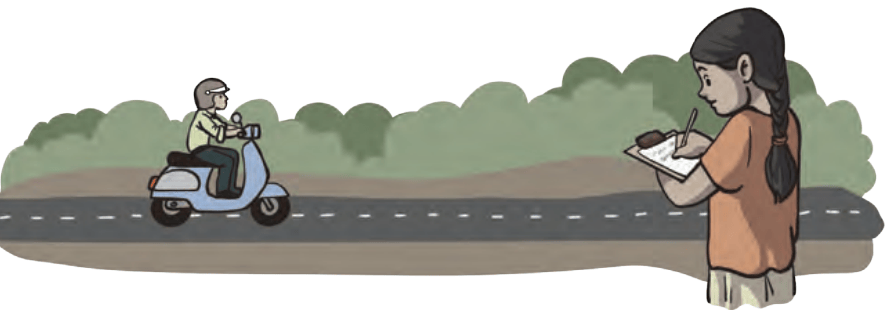
Deepti noted down the number of two-wheelers passing her house in one hour on three different days.
She used one icon (🏍) to show 3 two-wheelers.
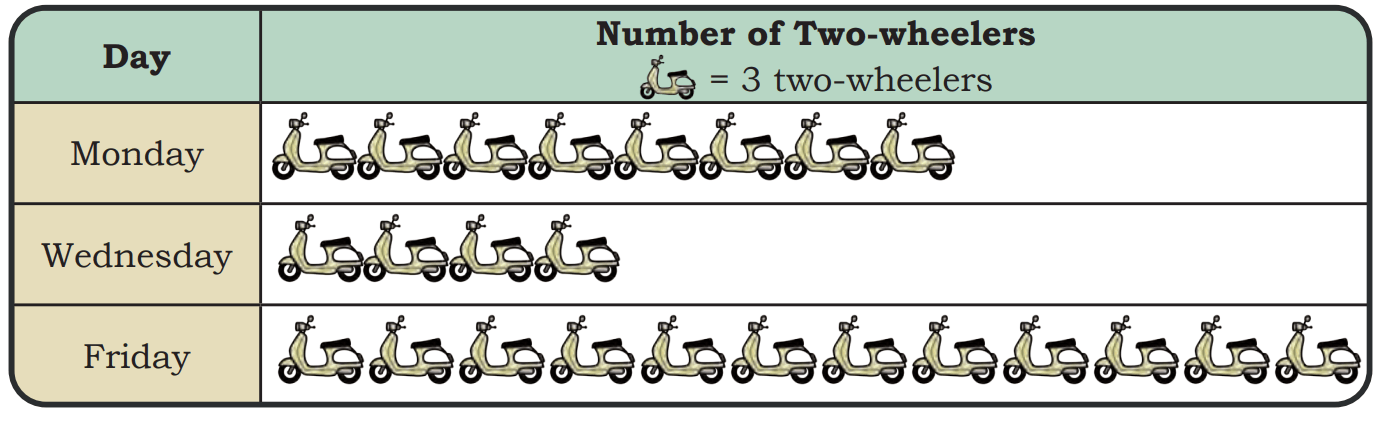
Observe the pictograph and answer the following questions.
- Which day had the most two-wheelers passing her house? ________
- How many total two-wheelers did she record over three days? ________
- How many fewer two-wheelers were seen on Wednesday than on Monday? ________
- How many more two-wheelers were seen on Friday than on Wednesday? ___________
- Choose any other scale and represent the same data using a pictograph in your notebook.
Recording a Day
One day Raman and Sheela decided to record how they spent their day.
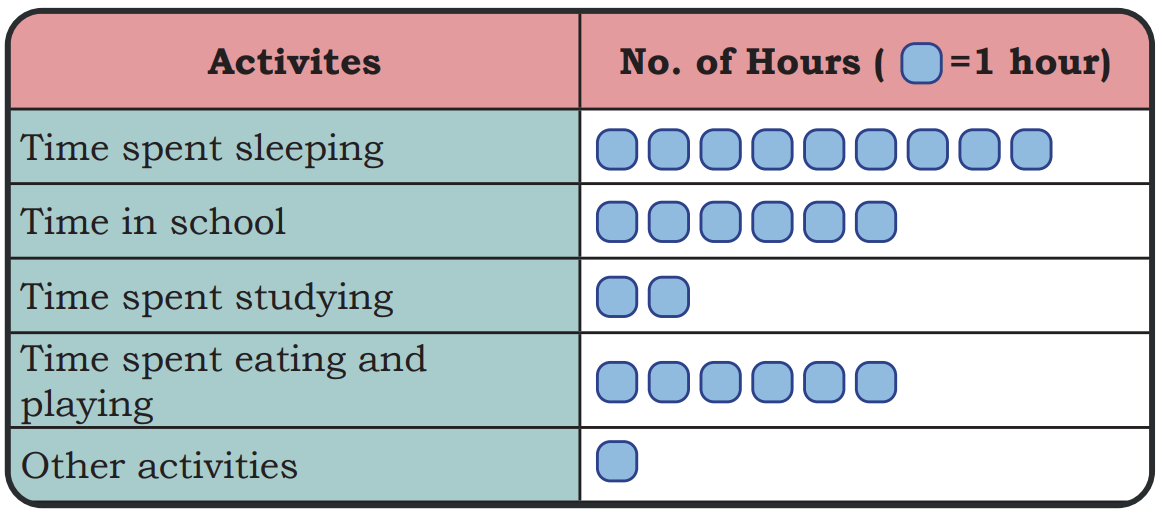
Raman recorded his daily routine in the table below
Sheela recorded her routine in the following manner.
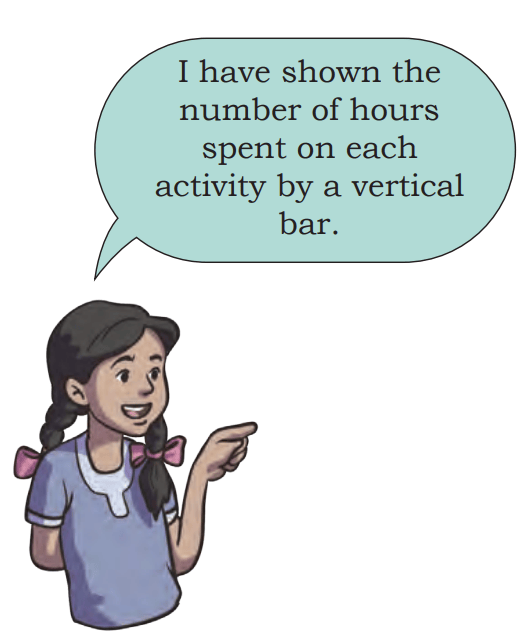
- I have shown the number of hours spent on each activity by a vertical bar.
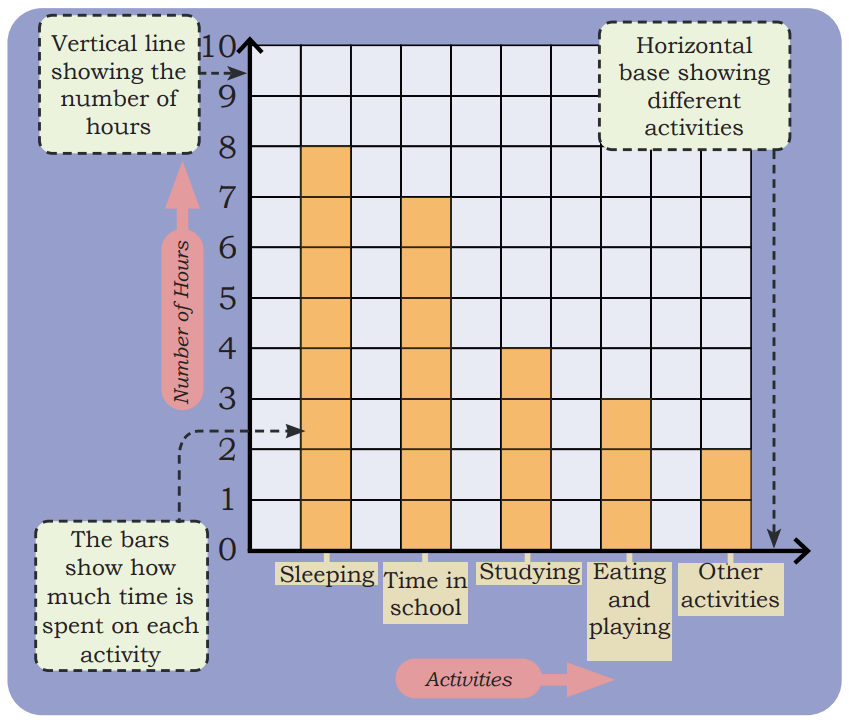
How is Sheela’s recording different from Raman’s recording? Discuss in class
Sheela’s way of recording the data is called a bar graph.
Observe Raman’s and Sheela’s routines and answer the following questions.
- Whose daily routine shows more time spent on sleeping? _____________________
- Who spends more hours in the school? _____________________
- How many more hours does Sheela spend studying compared to Raman? ______________________
- Is there any activity on which they spend the same amount of time? If yes, name the activity _____________________
- Based on their data, whose routine do you think is more balanced? Why? _____________________
Day in My Life
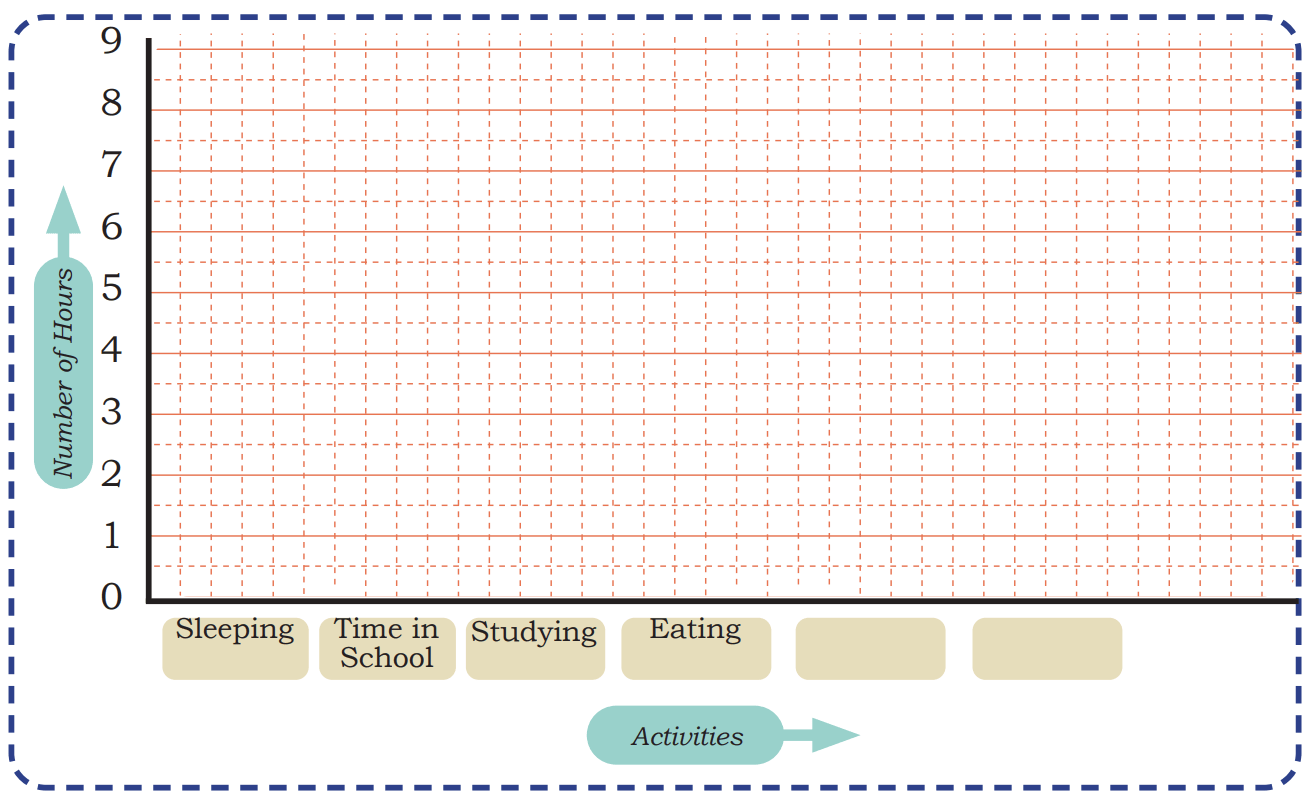
Record your daily routine (24 hours) in hours and minutes, as necessary. Note the time spent on activities like sleeping, studying, playing, eating, and others.
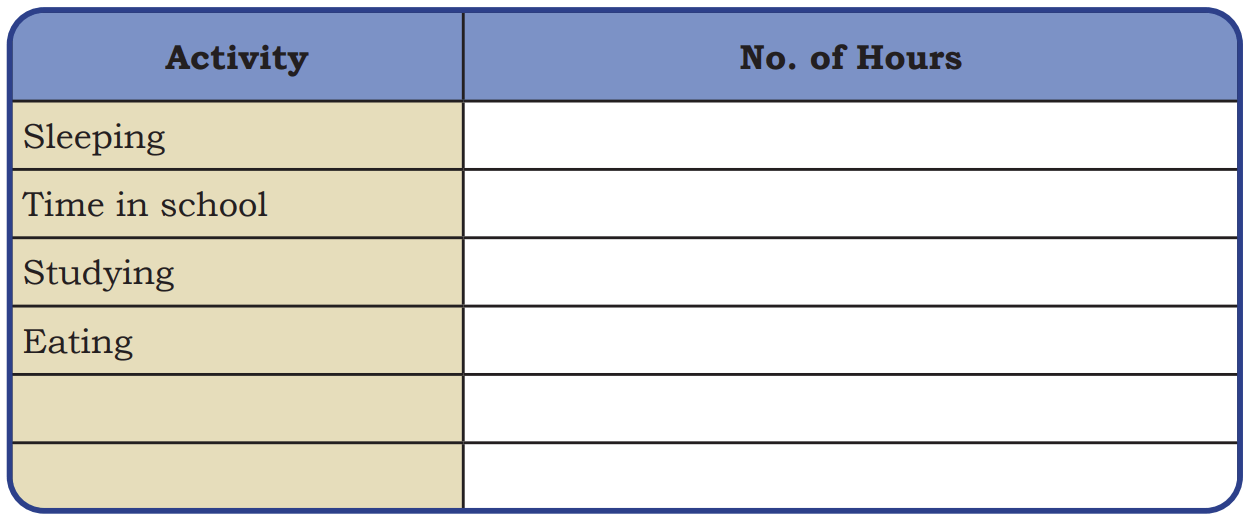
Make a bar graph of the time you spend on different activities in the space given below.
Whose Index Finger is Longer?
Cut long paper strips from waste paper. Give one strip (each of the same width) to each of your friends. Now, put the paper strip on your index finger and tear off the extra strip extending above your fingers.
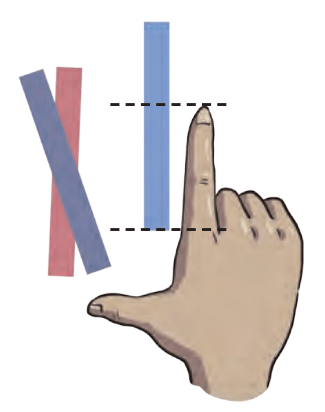
Paste these paper strips along the horizontal line in the given bar graph.
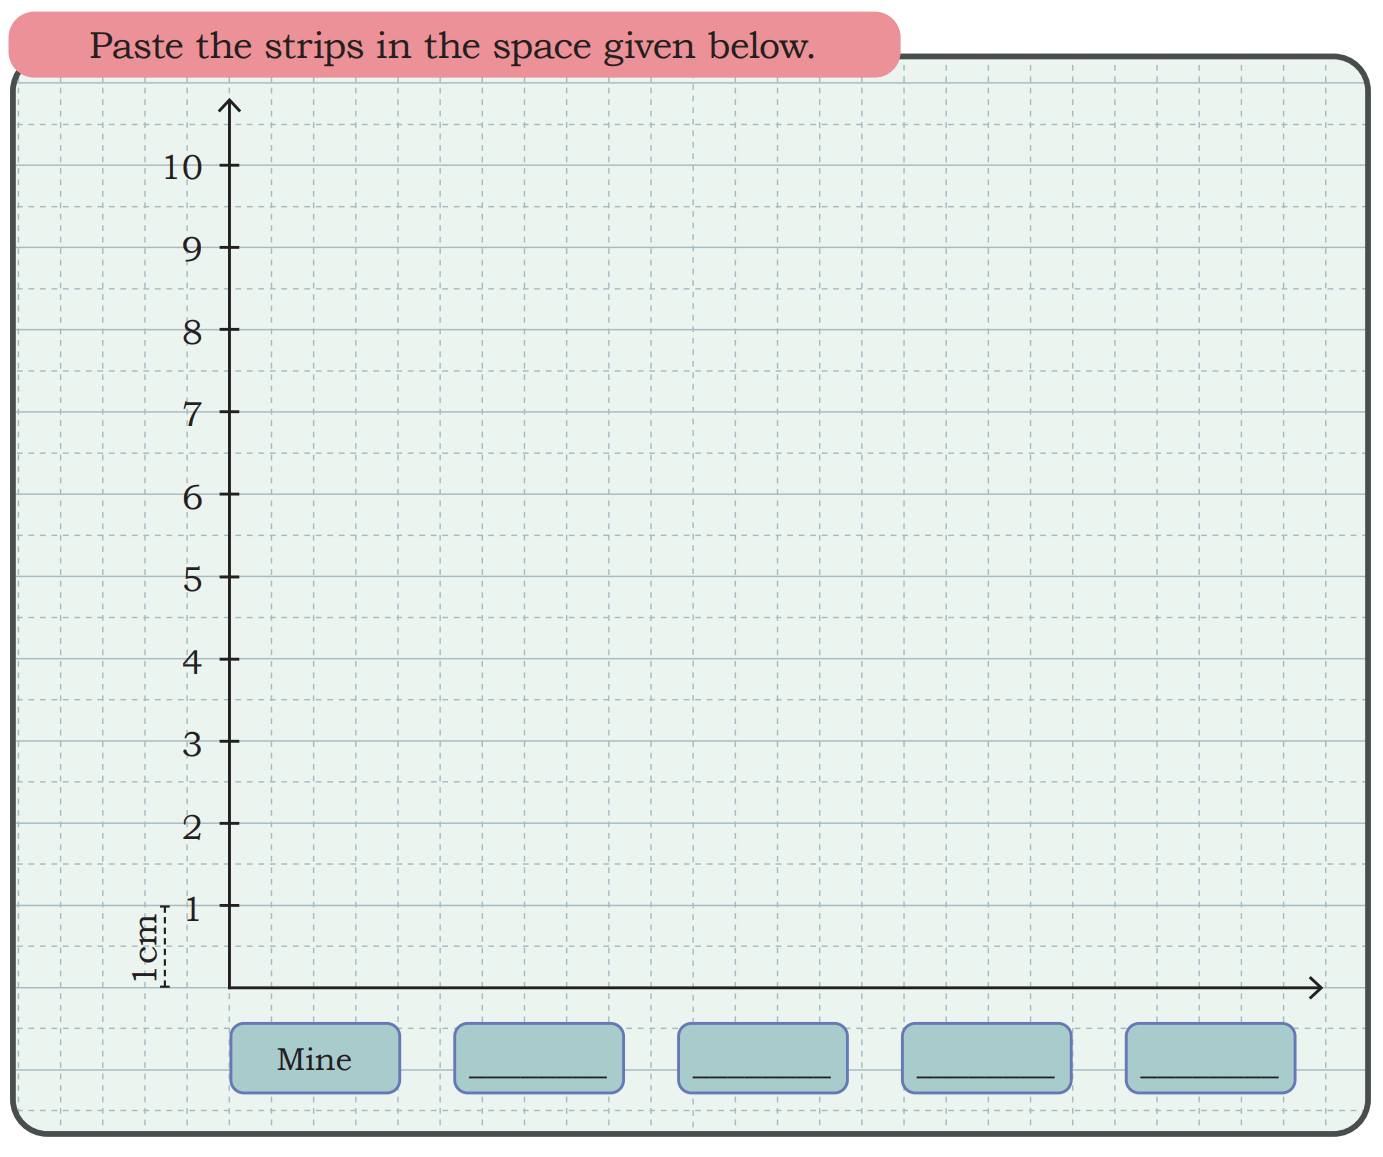
Write the answers to the following questions based on your graph.
- Whose index finger is the longest? ________ .
- The length of the longest index finger is _________ cm.
- The smallest index finger is ___________ cm long.
- It belongs to __________.
Food Wastage in the School Canteen
Rani stays in a residential school. Her school’s dining hall displays the amount of food wasted and the number of children the food could have fed.
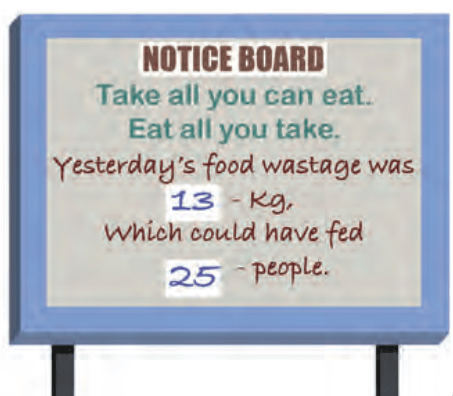
Given below is the data collected over the weekdays for different food items.
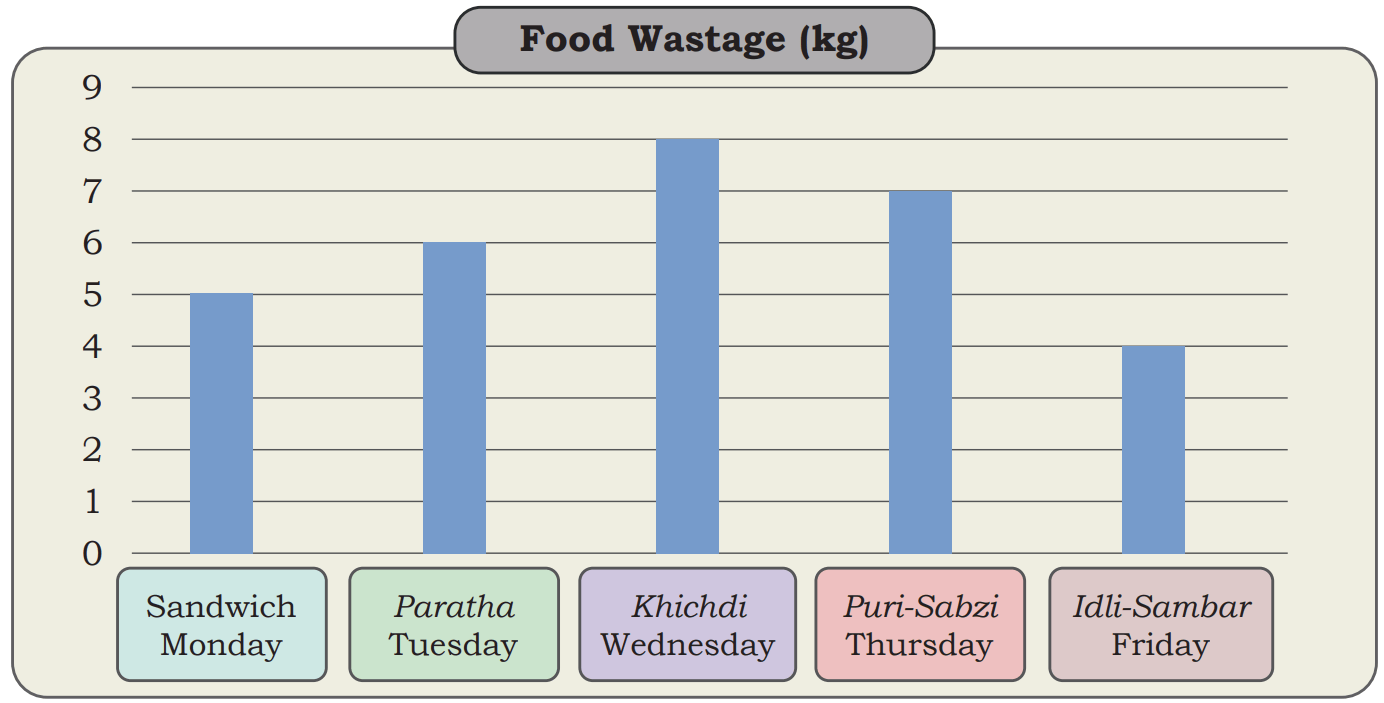
Rani was shocked to see the data. What do you think about food wastage? How can we reduce the wastage of food? What can we do with the leftover food?
Observe the above graph and answer the following questions.
- Which food item had the highest amount of wastage? _____________
- Which food item had the least amount of wastage? _______________
- How much total food wastage was recorded in these days? _________________
- If 1 kg of food waste can feed 3 children, how many children could have been fed with the total food wasted? ________________
- _______ day had less food wastage than _______ day.
- If the same food items are to be repeated next week, can you predict which food item is likely to be wasted the most?
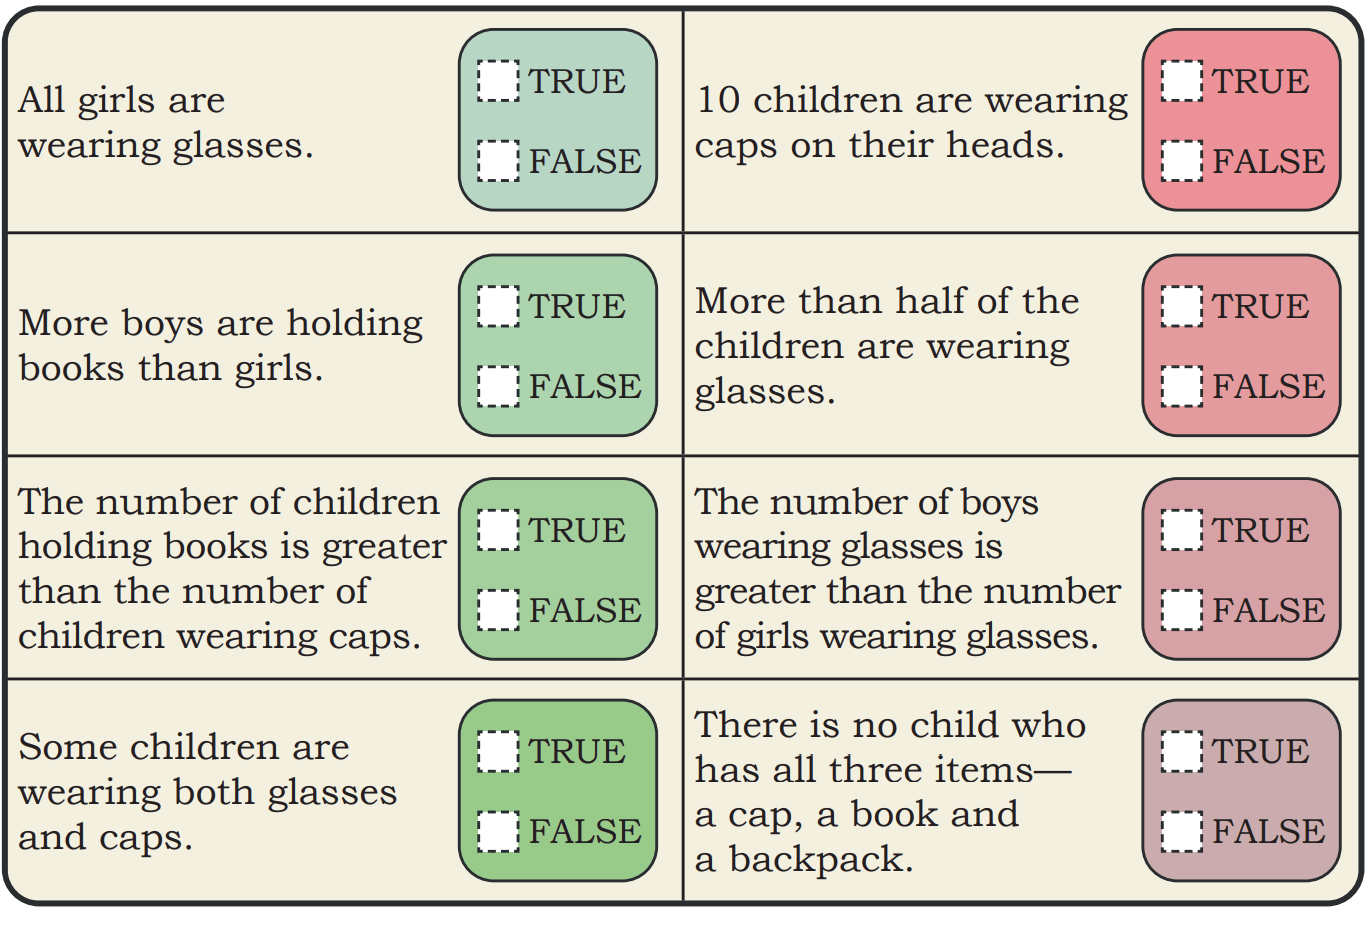
True or False
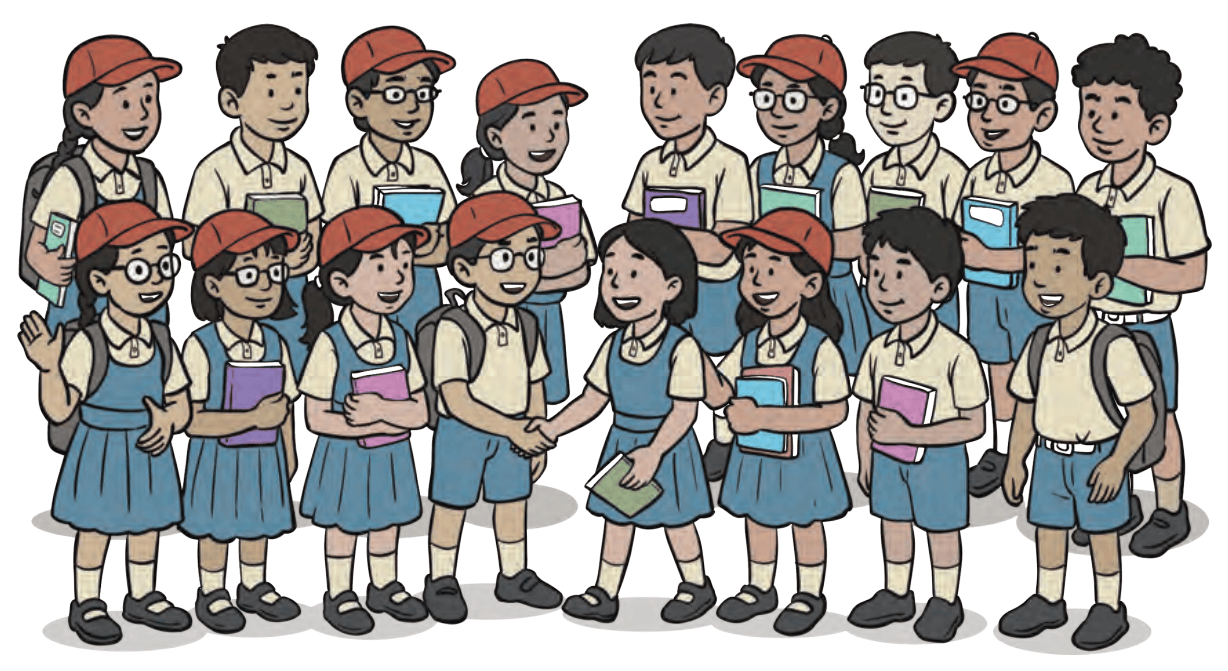
Observe the above picture carefully. Based on your observation, find out which of the following statements are true or false.
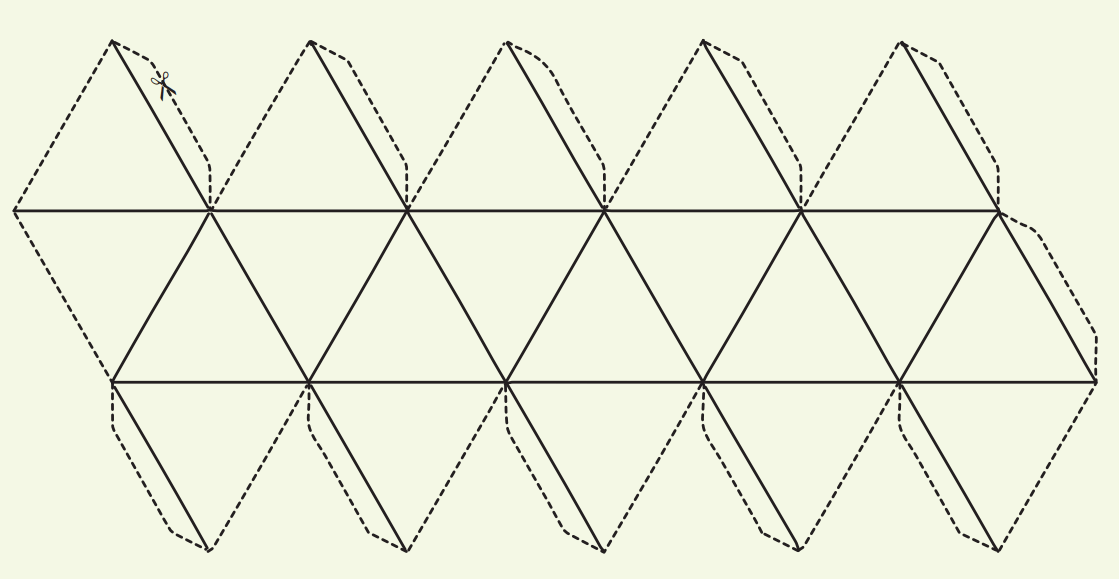
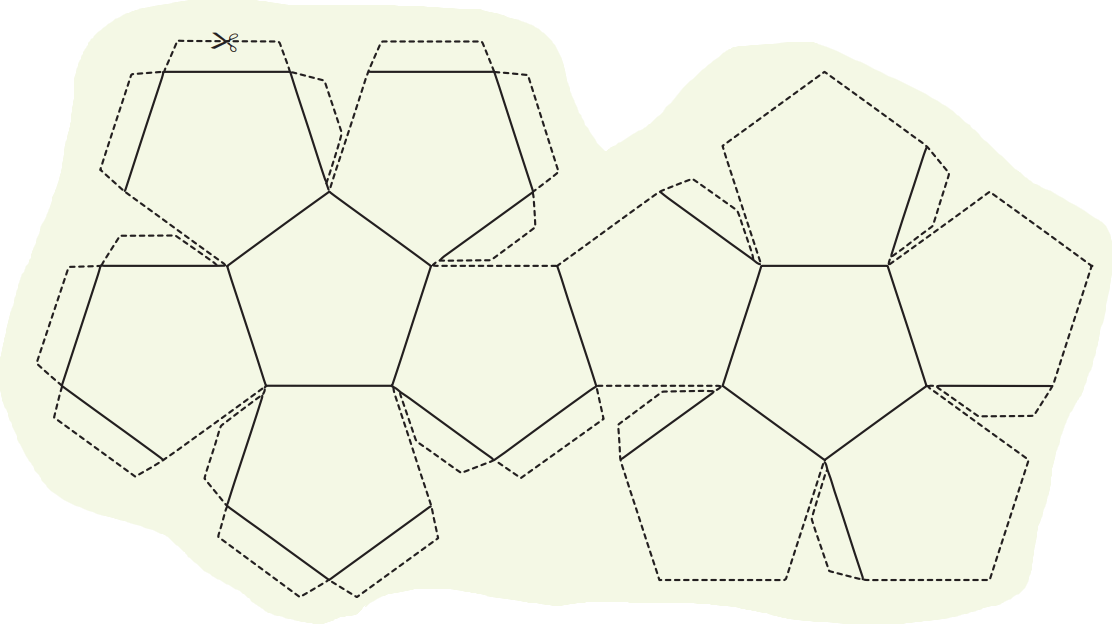
Cut along the dotted lines and fold along the solid lines