Chapter 7
Temperature and its Measurement
Wrong measurements are worse than
no measurements at all.
— Anna Mani
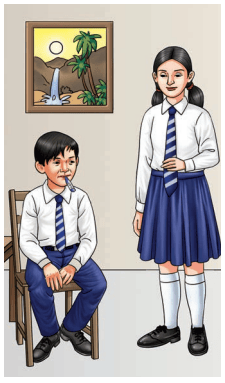
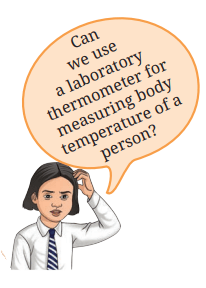
Lambok and his elder sister Phiban live in Shillong. One day they came home from school. Their parents were away at work and Lambok complained that he was feeling feverish. Phiban touched his forehead and felt that he might be having a fever. To confirm this, she took out the thermometer kept in the almirah. She washed its tip with soap and water, and measured Lambok’s temperature. To her relief, she found that his temperature was normal. She washed the thermometer tip again, dried it and put it back. She then asked Lambok to change his school uniform, eat his lunch, and rest for some time.
Can it always be
correctly judged, that
a person has fever,
only by touching the
person?
7.1 Hot or Cold?
We know from experience that some bodies are hotter than
others. For example, during summers, the tap water may be
hotter than the cold water from a matka (earthen pot) or a refrigerator. We can realise this by merely touching the two
samples of water. But can we always rely upon our sense of
touch? Let us find out.
Activity 7.1: Let us investigate
- Take three large containers and label them A, B and C, as shown in Fig. 7.1.
- Pour warm water in container A, tap water in B and icecold water in C.
- We will conduct this activity in two parts — prediction and observation.
- Firstly, predict what will you feel if you
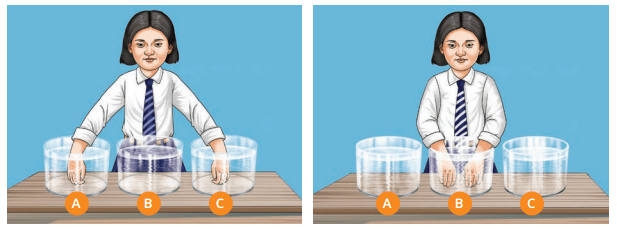
Fig. 7.1: Feeling hotness or coldness of water by dipping hands
- Write down your predictions.
__________
__________
- Now, conduct the activity and write your observations.
__________
Compare whether your observations match with your
predictions. Did your right hand feel that the water in
container B is cool, while your left hand felt that
the same water is warm?
What do you infer
from these observations?
We cannot always rely upon our sense of
touch to decide correctly whether a body is
hot or cold.
7.2 Temperature
A reliable measure of hotness (or coldness) of a body is
its temperature. A hotter body has a higher temperature
than a colder body. The difference in temperature between
the two bodies tells us how hot a body is in comparison to
another body. A device that measures temperature is called
a thermometer.
There are two kinds of thermometers that you are likely
to come across—clinical thermometers and laboratory
thermometers. Clinical thermometers are used to
measure human body temperatures whereas laboratory
thermometers are used for many other purposes. Let us
now learn more about thermometers and how to use them
to measure temperature.
7.3 Measuring Temperature
7.3.1 Clinical thermometer
You might be familiar with a thermometer, like that shown in
Fig. 7.2, which is used for measuring our body temperature.
It is called a clinical thermometer. Such thermometers show
temperatures digitally. These are also known as digital
clinical thermometers and run on batteries. These measure temperature when the thermometer is placed in contact
with a person’s body.
For measuring temperature, the clinical thermometers
generally use a scale called the Celsius scale. On this
scale, the unit of temperature is degree Celsius and is
denoted by °C.

Do you
know?
Earlier, mercury thermometers were used for measuring
the body temperature. But mercury is an extremely toxic
substance and is difficult to dispose of if the thermometer
breaks accidently.

Digital thermometers pose no such risk and also the
numbers in its display are easier to read. Therefore,
mercury thermometers are being replaced by digital
thermometers. Temperature in a digital thermometer
is determined with the help of heat sensors.
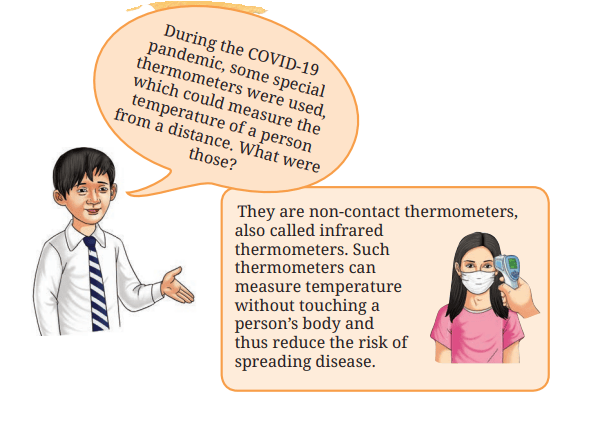
Activity 7.2: Let us measure
Let us now use a digital clinical thermometer
to measure body temperature. You may
measure your own temperature as well as
the temperature of some of your friends.
Talk to your friends to find out who would
be willing to get their body temperatures
measured by you.
- Wash your hands and the tip of the digital thermometer with soap and water.
- Reset the thermometer by pressing the reset button.
- Place the thermometer under the tongue and close your mouth.
- Wait till the thermometer makes a beeping sound or flashes a light.
- Take it out from the mouth and read the temperature on the digital display.
- Record the temperature in Table 7.1.
- Clean the tip of the thermometer with soap and water, and dry it.
- Repeat the above steps for measuring the temperatures of your friends
Precautions
to be taken while
using a digital clinical
thermometer
- To be used after reading the instruction manual of the thermometer.
- Tip of the thermometer tobe washed with soap and water before and after use.
- While washing, care to be taken to keep the digital portion such as the display out of water.
- Do not hold the thermometer by the tip.
Table 7.1: Body temperatures of 10 persons
The normal temperature of a healthy human body is taken
to be 37.0 °C. But in this activity, did you find that the normal
temperature of every person was 37.0 °C? Or did you find the
temperature slightly higher or lower for some people?
The temperature of every person may not
be 37.0 °C. What we call normal temperature
is the average body temperature of a large
number of healthy people. A perfectly
healthy person may, therefore, have a
normal temperature slightly different from
37.0 °C. The body temperature is influenced
by several factors, such as age, time of the
day and activity level.
You may try measuring your own
temperature at different times of the day and
on different days. Record the thermometer
readings in your notebook. After a month,
analyse your temperature record and see if
there are any variations. If yes, try to think
what might be the reasons for that.
The temperature of human beings does
not normally go below 35 °C or above 42 °C.
For measuring the body temperature
of small children or old people, the digital
thermometer can also be placed in the
armpit. The temperature measured this way
is about 0.5 °C to 1 °C lower than the actual
body temperature.
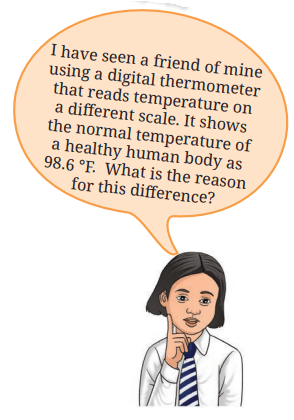
There is another scale of temperature
known as Fahrenheit scale. On this scale, the
unit of temperature is degreeFahrenheit and
is denoted by °F. A temperature measured as
37.0 °C on Celsius scale is equivalent to 98.6 °F
on Fahrenheit scale. The Fahrenheit scale is
not used in most scientific studies anymore.
In scientific work, there is another scale of
temperature known as Kelvin scale. On this
scale, the unit for temperature is kelvin and
is denoted by K. The SI unit of temperature
is kelvin.
All three temperature scales, Celsius, Fahrenheit and Kelvin are named in honour of the scientists who developed these scales.
Do small children
generally have
slightly higher body
temperatures as
compared to adults?
Do old people, even
when healthy, generally
have lower body
temperatures than
young adults?
We can easily convert the
temperature from Celsius scale to
Kelvin scale by using:
Temperature in Kelvin
scale = Temperature in
Celsius scale + 273.15
More to know!
The names of temperature scales—Celsius scale,
Fahrenheit scale and Kelvin scale—start with a capital
letter. For the units for temperature, degree Celsius and degree
Fahrenheit, the word degree starts with a lower-case letter while
Celsius and Fahrenheit start with a capital letter. The unit kelvin
starts with a lower-case letter. The symbols of all units (°C, °F, K) are
capital letters. Note that degree sign (°) is not written with K. A full
stop is not written after the symbol, except at the end of a sentence.
While writing the temperature, a space is left between the number
and the unit. For temperatures more than one degree, use the plural
of ‘degree’, that is, ‘degrees’, while writing the full form of the unit
Do you know!
How was fever detected before
thermometers were developed? Fever
affects the pulse rate of a person. This
was known even in olden days
in India. However, apart from
fever, some other situations
also affect the pulse rate.
Hence, pulse rate alone is not
a reliable indicator of fever.
Can a clinical
thermometer be
used for measuring
the temperature of
boiling water? Or
for measuring the
temperature of ice?
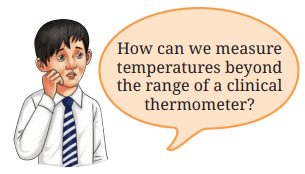
No, the
temperatures of
boiling water and
ice are outside the
range of a clinical
thermometer.
7.3.2 Laboratory thermometer
There are many types of laboratory thermometers but the
one that might be available in your school laboratory may
look like the one shown in Fig. 7.3a. It consists of a long,
narrow, uniform glass tube which is sealed. At one end of
the tube is a bulb which contains a liquid. Outside the bulb,
in the tube, a narrow column of liquid can be seen. There
is a Celsius scale marked along the tube. The liquid column
rises or falls with change in temperature. The mark of the
Celsius scale with which the top level of the liquid column
coincides is the temperature reading
Do you know!
The liquid used in the laboratory
thermometer is generally alcohol (coloured
red to make it easily seen) or mercury.

Fig.7.3(a):
A laboratory
thermometer
Activity 7.3: Let us observe
Let us try to find the temperature range of a given laboratory thermometer.
- Take a laboratory thermometer and observe it carefully.
- Note down the following:
— What is the lowest temperature it can measure? ________
— What is the highest temperature it can measure? ________
— So, the range of this thermometer is ________
Now look at the thermometer shown in Fig. 7.3a carefully. Can you tell its range? Its range is from –10 °C to 110 °C.
Precautions
to be taken while
using a laboratory
thermometer
- Handle with care. If
it hits against some
hard object, it can
break.
- Do not hold it by the
bulb.
Activity 7.4: Let us observe and calculate
Let us now try to find the smallest value that a given
laboratory thermometer can read
- Again, take the same laboratory thermometer which you used in Activity 7.3 and observe it carefully.
- Note down the following:
— How much is the temperature difference indicated
between the two bigger marks? ____
— How many divisions (shown by smaller marks)
are there between these two bigger marks? ____
— How much temperature does one small division
indicate?
— So, the smallest value that the thermometer can
read is _____
Fig. 7.3b shows a closeup of a part of the thermometer
shown in Fig. 7.3a. Can you now find the smallest value that
this thermometer can read?
For the thermometer shown in Fig. 7.3b, the
temperature difference indicated between 0 °C and
10 °C or between 10 °C and 20 °C is 10 °C. And the
number of divisions between these marks are 10
divisions. So, one small division can read 10/10 = 1 °C.
That is, the smallest value that this thermometer
can read is 1 °C.
Your school laboratory may have thermometers for
which the range and the value of the smallest division
may be different. It is, therefore, always necessary to
look carefully at the thermometer you are about to use.
You have learnt how to find the temperature
range of a given laboratory thermometer. You have
also learnt how to find the smallest value that
a given laboratory thermometer can read. We
will now learn how to measure temperature
using a laboratory thermometer. But, let us first
learn how to use a laboratory thermometer
correctly.

Fig. 7.3(b):
Closeup of a
part of the
thermometer
shown in
Fig. 7.3a.
Correct way of measuring temperature using a
laboratory thermometer
- When the thermometer is immersed in water, its bulb should not touch the bottom or the sides of the beaker.
- The thermometer should be held vertically (Fig. 7.4). It should not be tilted.
- The temperature must be read while the thermometer is immersed in water.
- While reading the
thermometer, the eye
should be directly in line with the level of the liquid column
to be read (Fig. 7.4).
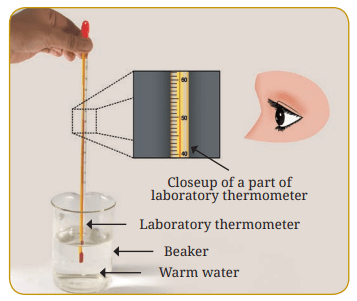
Fig.7.4: Measuring temperature of warm water
Activity 7.5: Let us measure
- Take some warm water in a beaker.
- Dip the thermometer in water so that the bulb is immersed in water (Fig. 7.4).
- Observe the rise of liquid column in the thermometer
Wait till the column stops rising and note the temperature (do not wait too long; otherwise, the water itself will start to cool).
What is the temperature of water measured by you? Compare it with the readings of your friends.
Do you notice that, as soon as you take the thermometer out of the water, the level of liquid column begins to fall?
This means that the temperature must be read while the thermometer is immersed in water
Following two experimental setups are to be arranged by your
teacher. One by one, as per your turn, go closer to the setups
and observe the readings of both the thermometers. What are
the temperatures of ice and boiling water
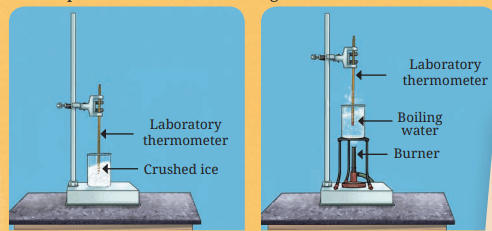
Read the temperatures of ice and boiling water again after
some time. Are the temperatures same or have changed? You
may have noticed that the temperature of water remains
constant while it is boiling. Also, the temperature of ice
remains constant while it is melting.
Caution
This activity
should be
performed strictly
only under
supervision of
the teacher. Do
not touch the
experimental
setups
Activity 7.6: Let us compare
- Phiban’s Science teacher arranged the experimental setup for measuring temperature of boiling water. The temperature readings of the boiling water taken by Phiban and her classmates in Shillong are given in Table 7.2
Table 7.2: Temperature of boiling water
- Compare the temperatures of boiling water recorded by
different students
Why are there differences in their readings? Discuss the
possible reasons amongst yourselves. Maybe, the correct way
of reading temperature was not followed by all the students.
7.3.3 Air temperature
You might have seen thermometers,
such as the one shown in Fig. 7.5, hung
on walls of your school laboratory,
doctor’s clinic, and hospitals. These
give an approximate idea of the
room temperature.
Have you seen weather reports
in newspapers, TV news or internet?
These reports also mention the
maximum and minimum air
temperature of the day.
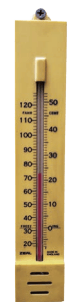
Fig.7.5: Room thermometer
Activity 7.7: Let us analyse
- Read or listen to the weather reports for a place for 10 successive days.
- Record the maximum and minimum air temperature for each day in Table 7.3
- Analyse the data in the Table 7.3
Table 7.3: Maximum and minimum air temperature
Does the maximum and minimum temperature stay at
the same level during these days?
Because weather depends on several factors, these
temperatures usually vary every day. Generally, as we
approach the summer season, the temperature rises and
during the winter season it falls
More to know!
There are many techniques for measuring
air temperature. Air temperature is an
important weather parameter and is
monitored at weather stations all over
the world. The data gathered on air
temperature along with various other
parameters are used for making weather
forecasts
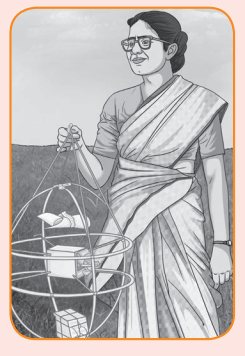
Know a scientist
Anna Mani (1918–2001)
was an Indian scientist,
also known as the ‘Weather
Woman of India’. She
invented and built a
large number of weather
measurement instruments.
This reduced the reliance of
India on other nations for
such instruments. She also
explored the possibilities
of using wind and solar
energy in India. Her work
helped India to become
one of the global leaders in
renewable energy.
Keywords
Summary
- The temperature of a body tells us how hot or cold it is.
- The three most-used scales of temperature are: (a) the Celsius scale, (b) the Fahrenheit scale, and (c) the Kelvin scale. The units of temperature in these scales are (a) degree Celsius, denoted by °C, (b) degree Fahrenheit, denoted by °F, and (c) kelvin, denoted by K.
- The SI unit for temperature is kelvin.
- A clinical thermometer is used for measuring body temperature.
- Normal temperature of a healthy human adult is taken to be 37.0 °C or 98.6 °F.
- Laboratory thermometers typically have a temperature range from –10 °C to 110 °C.
Let us enhance our learning
1. The normal temperature of a healthy human being is close to ______
(i) 98.6 °C
(ii) 37.0 °C
(iii) 32.0 °C
(iv) 27.0 °C
2. 37 °C is the same temperature as ______
(i) 97.4 °F
(ii) 97.6 °F
(iii) 98.4 °F
(iv) 98.6 °F
3. Fill in the blanks:
(i) The hotness or coldness of a system is determined by its ______
(ii) The temperature of ice-cold water cannot be measured by a ______ thermometer.
(iii) The unit of temperature is degree ______
4. The range of a laboratory thermometer is usually ______
(i) 10 °C to 100 °C
(ii) –10 °C to 110 °C
(iii) 32 °C to 45 °C
(iv) 35 °C to 42 °C
5. Four students used a laboratory thermometer to measure the temperature of water as shown in Fig. 7.6:
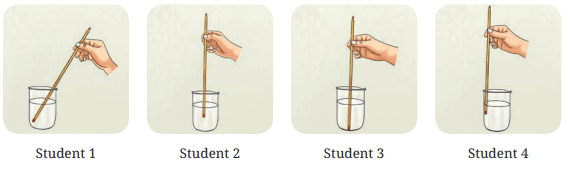
Fig. 7.6
Who do you think followed the correct way for measuring temperature?
(i) Student 1
(ii) Student 2
(iii) Student 3
(iv) Student 4
6. Colour to show the red column on the drawings of thermometers (Fig. 7.7) as per the temperatures written below:
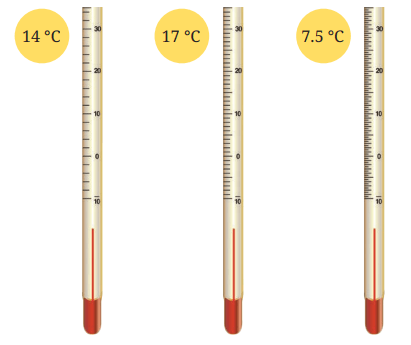
Fig. 7.7
7. Observe the part of thermometer shown in Fig. 7.8 and answer the following questions:

Fig. 7.8
(i) What type of thermometer is it?
(ii) What is the reading of the thermometer?
(iii) What is the smallest value that this thermometer canmeasure?
8. A laboratory thermometer is not used to measure our body temperature. Give a reason.
9. Vaishnavi has not gone to school as she is ill. Her mother has kept a record of her body temperature for three days as shown in Table 7.4.
Table 7.4: Body temperature record of Vaishnavi
(i) What was Vaishnavi’s highest recorded temperature?
(ii) On which day and at what time was Vaishnavi’s highest temperature recorded?
(iii) On which day did Vaishnavi’s temperature return to normal?
10. If you have to measure the temperature 22.5 °C, which of
the following three thermometers will you use (Fig. 7.9)?
Explain.
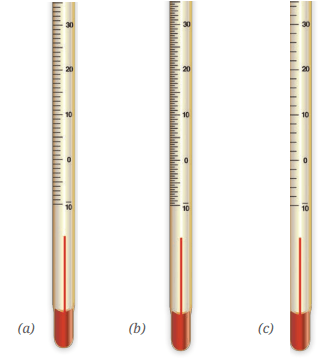
Fig. 7.9: Three thermometers
11. The temperature shown by the thermometer in Fig. 7.10 is
(i) 28.0 °C
(ii) 27.5 °C
(iii) 26.5 °C
(iv) 25.3 °C

12. A laboratory thermometer has 50 divisions between 0 °C and 100 °C. What does each division of this thermometer measure?
13. Draw the scale of a thermometer in which the smallest division reads 0.5 °C. You may draw only the portion between 10 °C and 20 °C.
14. Someone tells you that she has a fever of 101 degrees. Does she mean it on the Celsius scale or Fahrenheit scale?
Learning further
- Gather information from the Internet and find out how the body temperature of animals, such as a cat, dog, horse, camel, cow and buffalo, is measured. If there is any veterinary hospital in your vicinity, you may visit to see the body temperature of animals being measured.
- Find out which places in India are usually regarded to be the coldest and hottest. Also, find out the minimum and the maximum temperatures recorded for these places.
- Various planets in our Solar System are at different distances from the Sun. Search the Internet and make a table with the planets, their distances from the Sun (in increasing order) and their temperatures written. Does the average temperature of planets decrease as their distance from the Sun increases? If it is not true for any planet, find out for which planet and why.
- Hang a room thermometer in your classroom. Set up the apparatus, as shown in Fig. 7.11, near the thermometer hung on the wall.
Take the readings of thermometers 1 and 2 three times during the day, say, first period, lunch break, and last period.
Record your readings. Compare the readings and draw
your conclusions. Repeat this for two weeks.
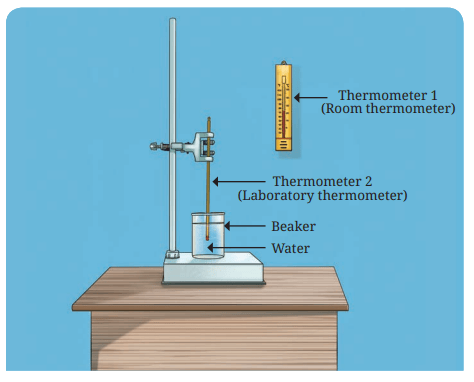
Fig. 7.11: Set up to measure temperature of water and room temperature
More to
know!
The temperature at the core of the Sun reaches
as high as 15 million degrees Celsius. Are
there objects in the sky that have even higher
temperatures? There is no limit on the highest
temperature that can exist. However, as per
scientific understanding, there is a limit to the
lowest temperature that can be achieved. It
is close to –273.15 °C (0 kelvin) and is called
absolute zero.