2 Understanding the Weather
"A change in the weather is sufficient to create
the world and oneself anew." — Marcel Proust, French novelist
The Big Questions?
1. How can we measure and
monitor the weather around us?
2. How do weather predictions
help us prepare for events like
heavy rain, storms, drought and
heat waves?
Weather and its Elements
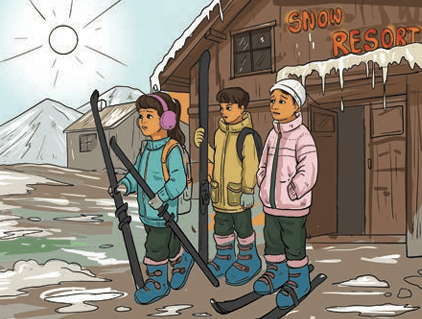
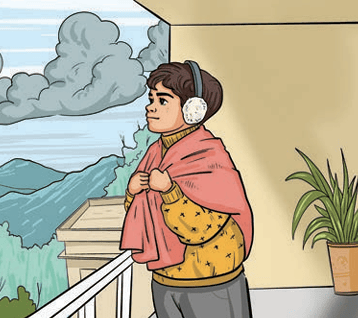
You wake up one winter morning and shiver. You reach for thick clothes to keep yourself warm. In the summer, you choose clothes that keep you cool and comfortable. You are responding to your body’s signals; your body is sensing the weather.
What is weather?
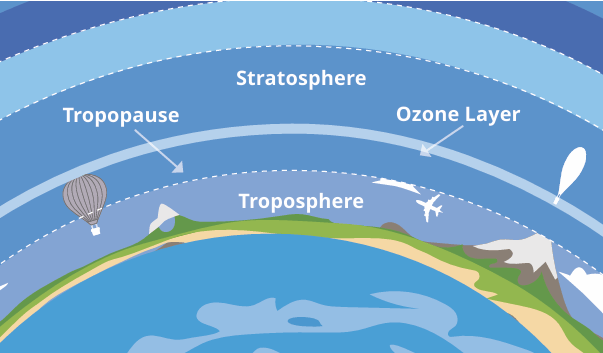
Weather is a state of
the Earth’s atmosphere
at a particular time and
place. But what is an
atmosphere? In simple
terms, it is the layer of
gases that surround
some planets — in the
case of our Earth, we
call these gases ‘air’. The
Earth’s atmosphere may
be compared to a cake
with several layers. The layer closest to the surface of the Earth is
called the ‘troposphere’, and that is where all land-based plants
and animals (including humans!) live and breathe. It is also
where almost all weather phenomena, which we will explore in
this chapter, take place. The troposphere extends to a height of
6 to 18 kilometres from the ground; it is less thick at the poles
(where the cold air contracts) and thicker in the tropical zone
(where the warmer air expands). You will study more about the
other layers in your Science classes.
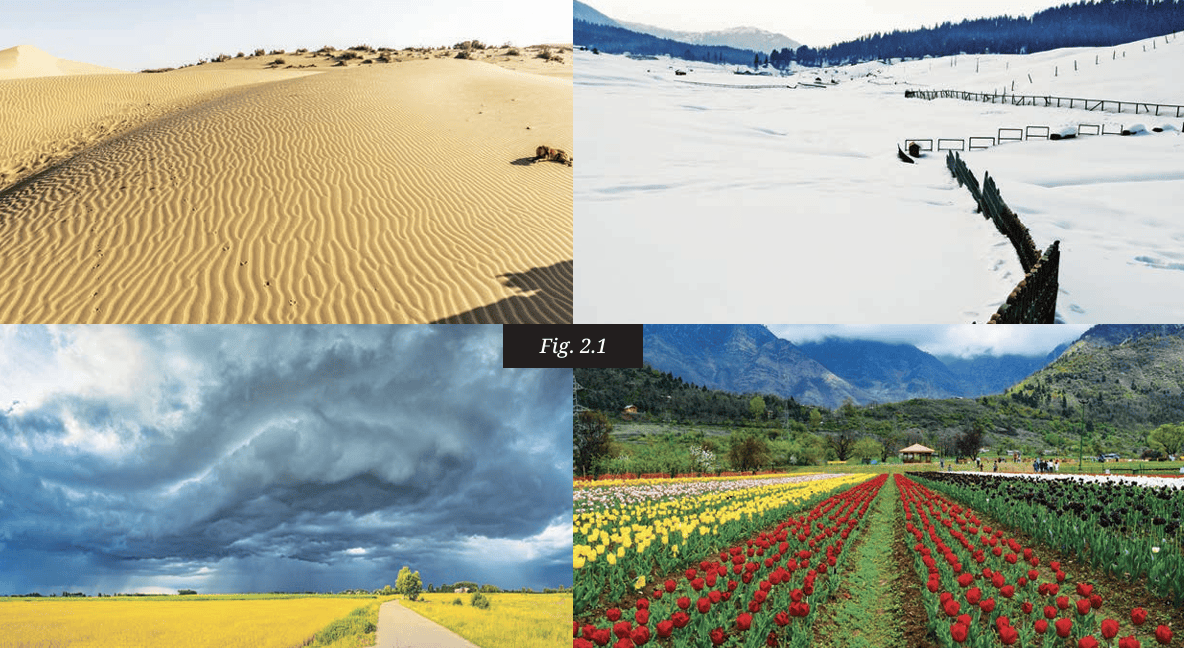
We use many words to describe the weather — hot, cold, rainy, cloudy, humid, snowy, windy, and so on. They describe the different ways in which we experience the elements of weather.
LET’S EXPLORE
What are some of the words in your local language that you
use to describe the weather? Hot, cold, warm, chilly, crisp,
pleasant, and so on, are commonly used terms in English.
- Temperature: How hot or cold the atmosphere is.
- Precipitation: Any form of water, such as rain, snow, sleet
or hail, that falls from the sky.
- Atmospheric Pressure: The weight of the air above us, felt
on the Earth’s surface.
- Wind: The movement of air, including its speed
and direction.
- Humidity: The amount of water vapour in the air.
Hail: Small, hard balls of ice that fall from the sky like rain.
Water vapour: Water vapour is water in gaseous instead of liquid form.
THINK ABOUT IT
Let us imagine that Krishnan from Chennai is speaking with
Amir in Kashmir. Krishnan tells Amir that it has become
chilly in Chennai after it rained the previous night. Amir asks
him how cold it is. How will Krishnan explain to Amir how
cold it is? After all, what is cold for Krishnan may be quite
pleasant for Amir!
LET’S EXPLORE
What do you think could be some other reasons to measure
the weather more precisely? (Hint: Think how knowing the
weather a few hours or a few days in advance would help you
plan some activities.)
Forecast: To predict or find out in advance (in our case, the weather).


LET’S EXPLORE
Talk to elders in your neighbourhood and ask them how they
predict the weather. What signs do they observe? Document
any sayings in your regional language that refer to weather
prediction.
In the last few centuries, scientists have worked out methods to measure and monitor the elements of the weather with great precision. Based on those inputs, meteorologists try to predict how the weather will behave in a particular region after a few hours or a few days, or even a few weeks. How do they do it? Do they just look up at the sky and guess? No, they’ve got some cool gadgets, a few of which we will now look at.
Weather Instruments
a) Temperature
LET’S REMEMBER
In your Grade 6 Science textbook, Curiosity, you read about
different types of thermometers used for measuring the
temperature — the clinical thermometer and the laboratory
thermometer. You also learnt about temperature scales.
One of them is the Celsius scale; another is the Fahrenheit
scale. If, for instance, we have a cool temperature of 15
degrees Celsius (noted as 15°C), it is the same as 59 degrees
Fahrenheit (noted as 59°F).

There are several types of thermometers. Some simply measure the ambient temperature; others record the maximum and minimum temperatures during a day. Thermometers often use a coloured liquid which expands when the temperature increases. However, more and more, digital thermometers are preferred as they are more precise and can record more data.
Indeed, temperature recordings can be used to collect some useful statistics, including:
- Range of temperature or the maximum temperature minus the minimum temperature during a particular period of time (usually 24 hours).
- Mean daily temperature or the maximum temperature plus the minimum temperature of the day divided by two.
Statistics: The technique of gathering and analysing information or data in order to be able to detect patterns, understand events or make predictions.
DON’T MISS OUT
- The India Meteorological Department was set up in 1875. Its motto is ādityāt jāyate vriṣhti, which means, “From the sun arises rain.” The phrase comes from the ancient text Manusmṛiti, and the complete sentence reads, “From the sun arises rain, from rain comes food, and from food, living beings originate.”
- Can you think of a reason why rain arises from the sun?
LET’S EXPLORE
Here’s a chart of the temperatures of a city in Madhya
Pradesh. What is the maximum temperature recorded in
the week shown here? What is the minimum? Calculate
the range.
| Date | Maximum Temperature (in °C) | Minimum Temperature (in °C) |
|---|---|---|
| 28.02.2025 | 29 | 16 |
| 01.03.2025 | 30 | 15 |
| 02.03.2025 | 31 | 17 |
| 03.03.2025 | 32 | 18 |
| 04.03.2025 | 30 | 17 |
| 05.03.2025 | 28 | 14 |
| 06.03.2025 | 29 | 15 |
Remember the conversation between Krishnan and Amir? If Krishnan said it was 20°C in Chennai and he was feeling a little cold, he and Amir would have a measure they could understand. What do you think Amir’s reaction to Krishnan’s statement might be?
b) Precipitation
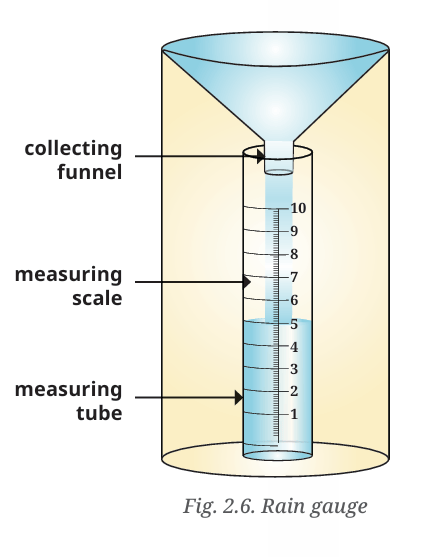
If the news says that a particular place received 30 mm of rainfall in a day, what does it mean? How is rainfall measured?The amount of rainfall is measured with the help of an instrument called a rain gauge (Fig. 2.6). When it rains, the water falls into a funnel and is collected in a cylinder. A scale is attached to the cylinder to measure the depth of rainwater collected. For example, when the height of the water collected is 5 mm, we say that the area received 5 mm of rainfall.
LET’S EXPLORE
Make a rain gauge as shown in the diagram above. Place the
rain gauge in an open area, away from objects that might
obstruct rain. Ensure that the rain gauge is on a flat surface
and will not tilt or topple with the wind. Using the measuring
scale, record the amount of rainwater collected at the same
time every day, for a month. (If there is snow, allow it to
melt before taking the measurement.) Calculate the average
rainfall for every week in that month and comment on the
variation from week to week.
c) Atmospheric pressure
Our bodies are quite aware of temperature and rainfall. But you may also have experienced that the weather sometimes feels ‘heavy’, as before a thunderstorm. This is related to atmospheric pressure, which is the pressure exerted by the weight of the air above and around us.The atmospheric pressure is higher near the sea coast and lower as we go higher up into the mountains. When you climb a mountain, the air gets thinner than in the plain below. As a result, the air pressure is lower, and there is less oxygen available for your lungs to take in. With less oxygen getting into your blood, your body has to work harder to keep you moving! That’s why people sometimes feel breathless, dizzy or tired at high altitudes.
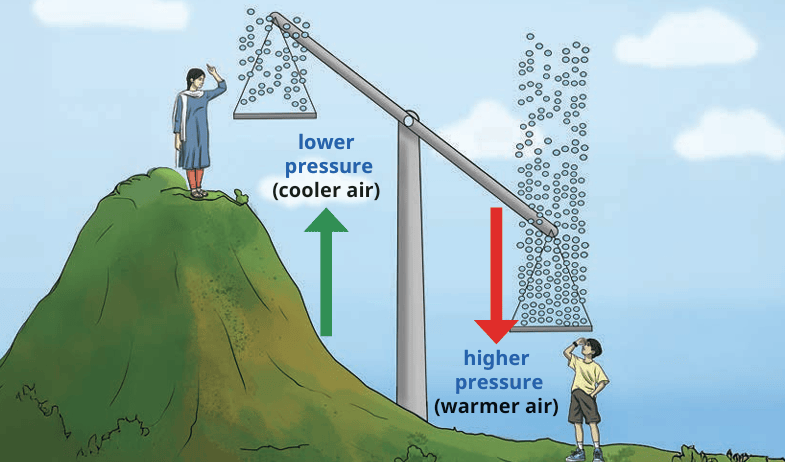
This does not mean that the atmospheric pressure is always high in the plains below or on the coast. In fact, it sometimes drops dramatically, resulting in what meteorologists call a ‘depression’ or ‘low-pressure system’, which can sometimes develop into a storm or even a cyclone.
THINK ABOUT IT
Why do you think it would be important to measure
atmospheric pressure? Who are the people most likely to use
such measurements?
THINK ABOUT IT
People who journey to places
at a high altitude are advised
to make pauses on the way to
allow the body to acclimatise.
Our army personnel serve
in high-altitude places like
Khardung la in Ladakh, which
is over 5600 metres above sea
level. It is hard to imagine
how they live and work in
places where the oxygen level
is so low — the atmospheric
pressure there is generally
about 650 millibars!

d) Wind
Wind is the movement of air from areas of high pressure to areas of low pressure. Speed and direction are two important factors when we describe the wind.THINK ABOUT IT
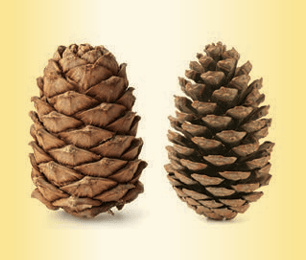
Have you seen seeds like these flying in the wind? What
would happen to the seeds if there was no wind?

So, how do we measure this direction and speed? A wind vane (or weather vane) has a rotating arm with a pointer at one end and a tail at the other. When the wind blows, the tail is pushed, and the pointer turns in the direction of the wind. It responds even to a light breeze.
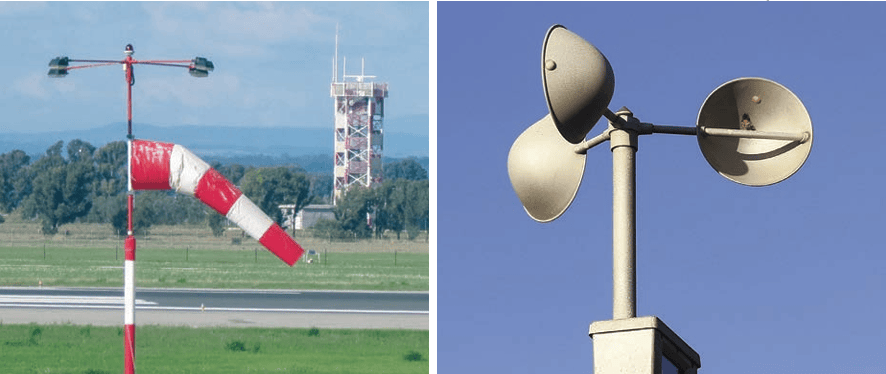
The simplest instrument to measure the wind direction and speed is the anemometer. It has three or four metal cups that rotate on a vertical shaft when the wind blows — the stronger the wind, the faster the rotation. A meter attached at the bottom counts how many times the anemometer spins in a certain period of time and calculates the wind speed in kilometres per hour (km/h).
e) Humidity
Humidity is the last element of the weather on our list. It refers to the amount of water vapour present in the air. It also depends on factors like temperature, wind, pressure and location.LET’S EXPLORE
Where do you think humidity is likely to be more, Kochi or
Jaipur? You might guess that Kochi has higher humidity than
Jaipur because it is located near the sea. But how will we know
for sure? If we had to compare the humidity level between
Kochi and Mangaluru, how would we do it? Discuss with your
classmates.
Before we move forward, we need to remember our Science lesson from Grade 6 about the states of water. This will help us to understand how humidity is measured.
LET’S REMEMBER
- When water evaporates, it causes a cooling effect.
- If the amount of water in the air is already high (more humidity), water evaporates slowly. That is typically the case on a rainy day.
THINK ABOUT IT
If the humidity in Delhi is at 52% while in Kochi it is 84%, in
which of the two places are wet clothes likely to dry faster?
And where are you likely to sweat more, assuming the
temperature is the same in both places?
Weather Stations
As you can see, we need several instruments to measure the weather at a particular place and time. A weather station brings all these instruments together, making it easy to measure and track the weather. Readings of all the measurements are taken at regular intervals, which helps in mapping and forecasting the weather.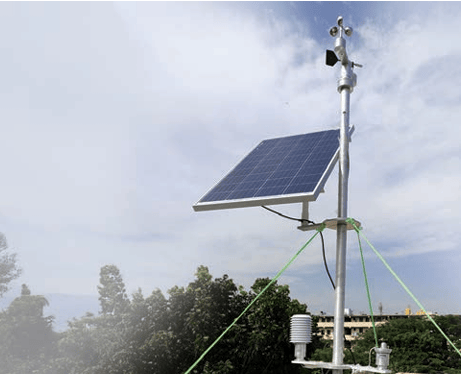
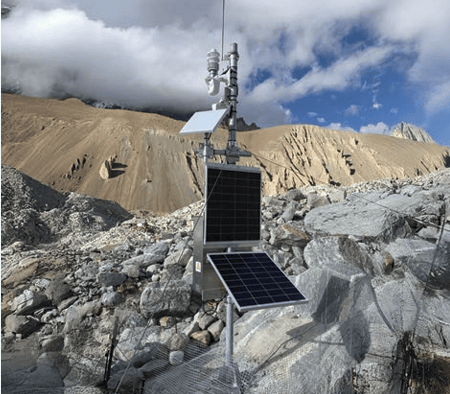
An automated weather station
An Automated Weather Station (AWS) is a self-operating system that uses various sensors to measure and record weather data, such as temperature, humidity, wind speed and direction, precipitation, and atmospheric pressure. Such stations are widely used in fields like agriculture, aviation, navigation, environmental monitoring, and so on, providing accurate and timely weather information without the need for human intervention.
DON'T MISS OUT
In 2023, the National Disaster
Management Authority set
up an AWS at a glacial lake of
Sikkim at an altitude of more
than 4800 metres above sea
level. The AWS provides early
information about upcoming
weather conditions.
Predicting the Weather
Meteorologists collect data using these instruments over long periods of time. They study the data and use scientific methods to try and predict the weather. Such predictions are very important nowadays, as climate change makes extreme weather, such as droughts, floods, cyclones, etc., more frequent.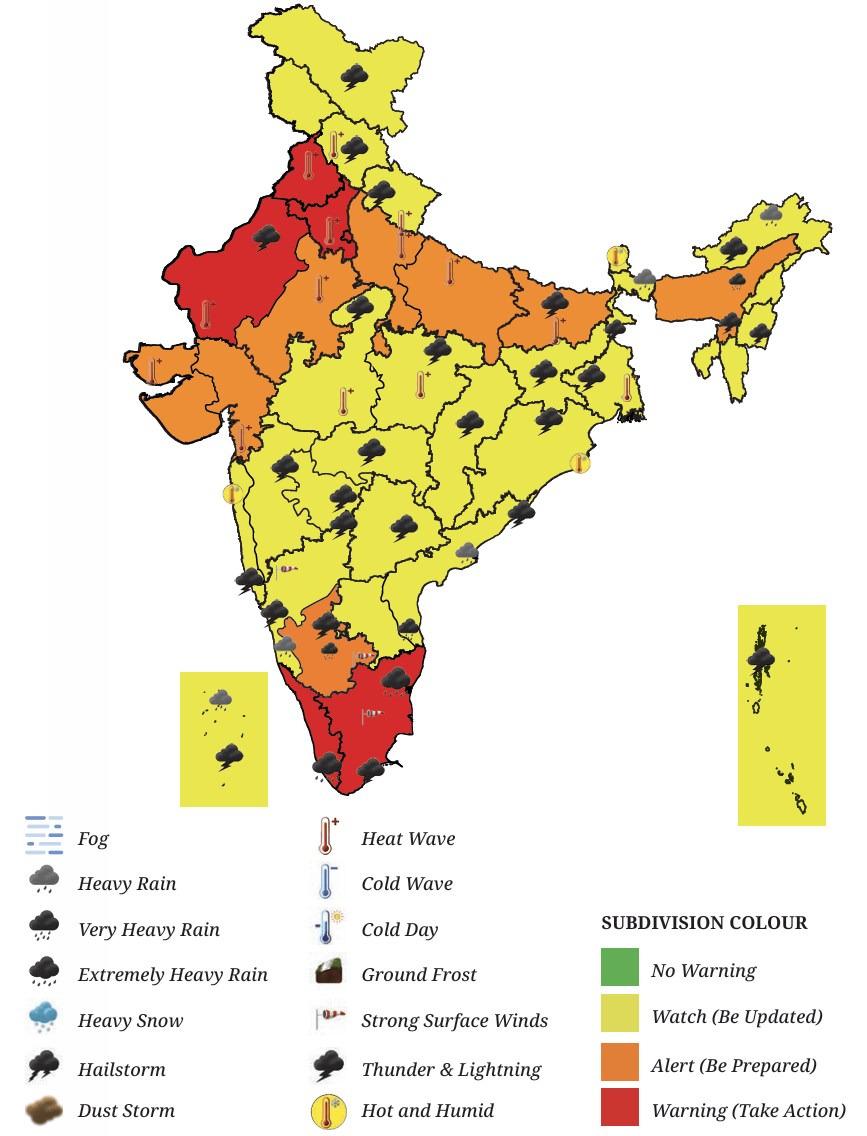
Accurate predictions help us to be ready for such events. They also enable local governments to mobilise resources and prepare for any disasters. For example, if stormy weather is expected at sea, fishermen are warned about venturing out in their boats, or an entire coastal area might have to be evacuated if a cyclone is expected.
LET’S EXPLORE
Notice the concentration of lighting in the plains. What could
be the reason for this concentration?
LET’S EXPLORE
- What do you observe happening on that day? What are the various weather conditions that the IMD is alerting people to?
- Which states have warning signs?
- Which parts of India are likely to be free from severe weather?
- Which states are likely to face heat wave conditions?
- What are the causes for warning in Tripura and Lakshadweep?
Before we move on ...
- Temperature, humidity, precipitation, wind and atmosphericpressure together define the weather at a particular place.
- The condition of these elements is measured using special instruments. Data collected from these help us to monitor and predict the weather.
- In different times or situations, one of the elements is dominant — for example, rainfall in July, the temperature in May and December, atmospheric pressure when a cyclone is moving, and wind when a loo (strong, hot and dusty winds that blow in north India in summers) is blowing, or forest fires are spreading.
- Weather is closely linked to climate. We will discuss this in the next chapter.
Questions and activities
1. Match the instrument with the weather element it measures.| Instrument used | Element of the Weather |
|---|---|
| (1) Hygrometer | (d) Humidity |
| (2) Anemometer | (c) Wind direction and speed |
| (3) Barometer | (b) Atmospheric pressure |
| (4) Thermometer | (e) Temperature |
| (5) Rain gauge | (a) Precipitation |
2. Jyotsna is deciding what clothes to pack for her school trip to Mumbai in June. She looks at the weather forecast, which predicts 29°C and 84% humidity. What would be your advice to her?
3. Imagine that a small group of students is setting up a rain gauge.
Here are some options for the site.- 1. The school vegetable garden.
- 2. The terrace of the school building.
- 3. Open ground with elevated platform.
- 4. Compound wall of school.
- 5. Verandah of the school laboratory.
4. Below is a chart taken from IMD, Jammu and Kashmir. Looking at the data available, write a short script to report the weather conditions in different parts of Jammu and Kashmir on the date shown. (Hint: Cover the temperature range, maximum and minimum temperatures, humidity, precipitation, etc.)
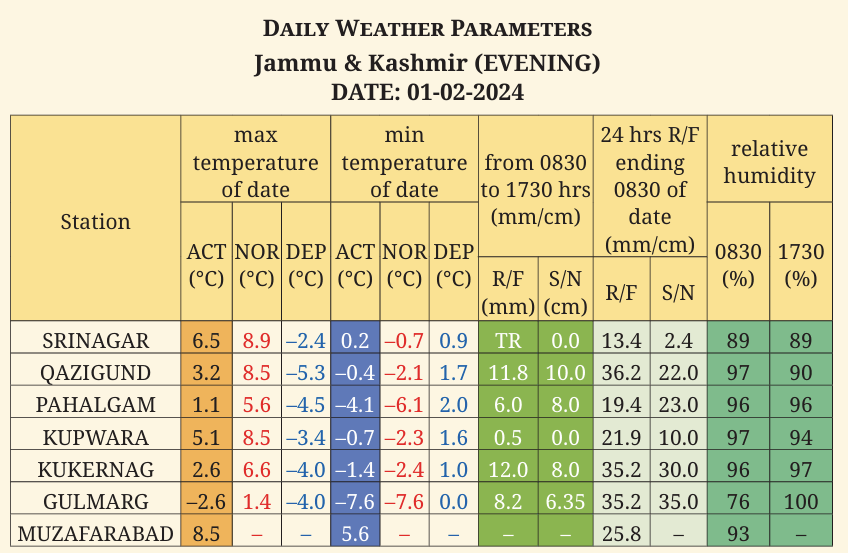
Note: ACT means actual; NOR means normal; DEP is departure from normal; R/F is rainfall; S/N is snowfall; TR means trace amount.