The speed-time graph for a car is shown is Fig. 8.12.
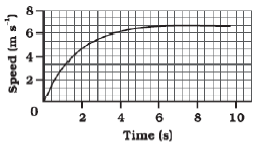
(a) Find how far does the car travel in the first 4 seconds. Shade the area on the graph that represents the distance travelled by the car during the period.
(b) Which part of the graph represents uniform motion of the car?

(a) Distance travelled by car in the 4 second
The area under the slope of the speed – time graph gives the distance travelled by an object.
In the given graph
56 full squares and 12 half squares come under the area slope for the time of 4 second.
Total number of squares = 56 + 12/2 = 62 squares
The total area of the squares will give the distance travelled by the car in 4 second.
On the time axis, 5 squares = 2s
∴ 1 square =25s=25s
On the speed asix 3 squares = 2 m/s
∴ 1 square =23m/s=23m/s
∴ area of 1 square =25s×23m/s=415m=25s×23m/s=415m
∴ area of 62 squares =415m×62=415m×62
24815m=16.53m24815m=16.53m
Therefore, car travels 16.53 m in first 4 second.
(b) Part MN of the slope of the graph is straight line parallel to the time axis, thus this potion of graph represents uniform motion of car.