Table of Contents

Chapter 9
Data Handling
9.1 Introduction
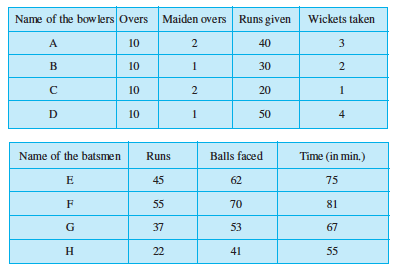
You must have observed your teacher recording the attendance of students in your class everyday, or recording marks obtained by you after every test or examination. Similarly, you must have also seen a cricket score board. Two score boards have been illustrated here :
Similarly, in your day to day life, you must have seen several kinds of tables consisting of numbers, figures, names etc.
These tables provide ‘Data’. A data is a collection of numbers gathered to give some information.
9.2 Recording Data
Let us take an example of a class which is preparing to go for a picnic. The teacher asked the students to give their choice of fruits out of banana, apple, orange or guava. Uma is asked to prepare the list. She prepared a list of all the children and wrote the choice of fruit against each name. This list would help the teacher to distribute fruits according to the choice.
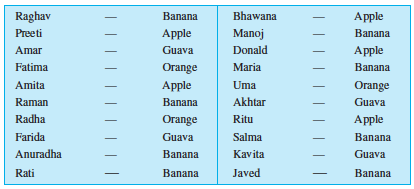
If the teacher wants to know the number of bananas required for the class, she has to read the names in the list one by one and count the total number of bananas required. To know the number of apples, guavas and oranges separately she has to repeat the same process for each of these fruits. How tedious and time consuming it is! It might become more tedious if the list has, say, 50 students.


So, Uma writes only the names of these fruits one by one like, banana, apple, guava, orange, apple, banana, orange, guava, banana, banana, apple, banana, apple, banana, orange, guava, apple, banana, guava, banana.
Do you think this makes the teacher’s work easier? She still has to count the fruits in the list one by one as she did earlier.
Salma has another idea. She makes four squares on the floor. Every square is kept for fruit of one kind only. She asks the students to put one pebble in the square which matches their choices. i.e. a student opting for banana will put a pebble in the square marked for banana and so on.
Try to perform this activity for 40 students and with names of any four fruits. Instead of pebbles you can also use bottle caps or some other tokens.
9.3 Organisation of Data
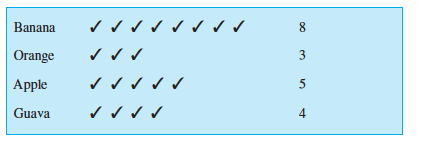
To get the same information which Salma got, Ronald needs only a pen and a paper. He does not need pebbles. He also does not ask students to come and place the pebbles. He prepares the following table.
Do you understand Ronald’s table?
What does one (✓) mark indicate?
Four students preferred guava. How many (✓) marks are there against guava?
How many students were there in the class? Find all this information.
Discuss about these methods. Which is the best? Why? Which method is more useful when information from a much larger data is required?
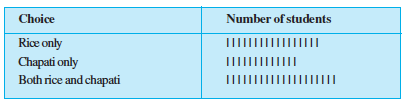
Example 1 : A teacher wants to know the choice of food of each student as part of the mid-day meal programme. The teacher assigns the task of collecting this information to Maria. Maria does so using a paper and a pencil. After arranging the choices in a column, she puts against a choice of food one ( | ) mark for every student making that choice.
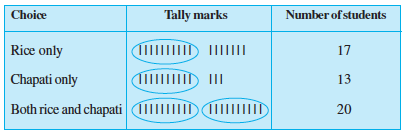
Rajan made it simpler by asking her to make groups of five instead of ten, as shown below :
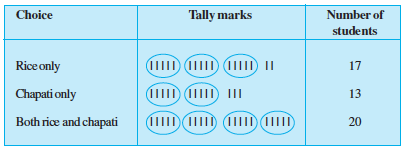
Teacher suggested that the fifth mark in a group of five marks should be used as a cross, as shown by  ’. These are tally marks. Thus,
 shows the count to be five plus two (i.e. seven) and
 shows five plus five (i.e. ten).
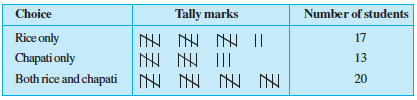
With this, the table looks like :
Example 2 : Ekta is asked to collect data for size of shoes of students in her Class VI. Her finding are recorded in the manner shown below :
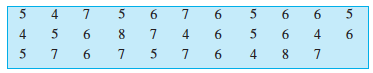
Javed wanted to know (i) the size of shoes worn by the maximum number of students. (ii) the size of shoes worn by the minimum number of students. Can you find this information?
Ekta prepared a table using tally marks.
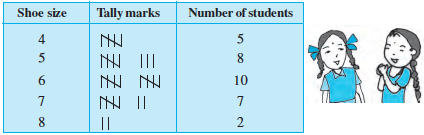
Now the questions asked earlier could be answered easily.
You may also do some such activity in your class using tally marks.
![]()
1. Collect information regarding the number of family members of your classmates and represent it in the form of a table. Find to which category most students belong.
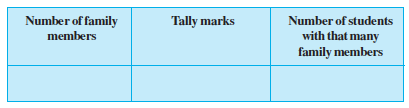
Make a table and enter the data using tally marks. Find the number that appeared
(a) the minimum number of times? (b) the maximum number of times?
9.4 Pictograph
A cupboard has five compartments. In each compartment a row of books is arranged.
The details are indicated in the adjoining table :
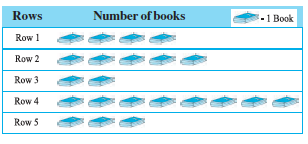
Which row has the greatest number of books? Which row has the least number of books? Is there any row which does not have books?
You can answer these questions by just studying the diagram. The picture visually helps you to understand the data. It is a pictograph.
A pictograph represents data through pictures of objects. It helps answer the questions on the data at a glance.
![]()

Pictographs are often used by dailies and magazines to attract readers attention.
Collect one or two such published pictographs and display them in your class. Try to understand what they say.
It requires some practice to understand the information given by a pictograph.
9.5 Interpretation of a Pictograph
Example 3 : The following pictograph shows the number of absentees in a class of 30 students during the previous week:
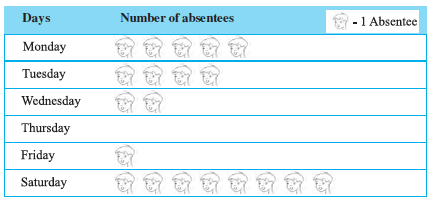
(a) On which day were the maximum number of students absent?
(b) Which day had full attendance?
(c) What was the total number of absentees in that week?
(b) Against thursday, there is no picture, i.e. no one is absent. Thus, on that day the class had full attendance.
(c) There are 20 pictures in all. So, the total number of absentees in that week was 20.
Example 4 : The colours of fridges preferred by people living in a locality are shown by the following pictograph :
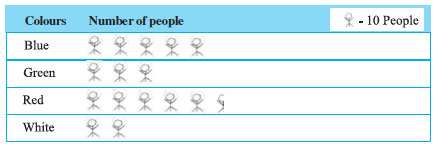
(a) Find the number of people preferring blue colour.
(b) How many people liked red colour?
Solution : (a) Blue colour is preferred by 50 people.
[ = 10, so 5 pictures indicate 5 × 10 people].
(b) Deciding the number of people liking red colour needs more care.
For 5 complete pictures, we get 5 × 10 = 50 people.
For the last incomplete picture, we may roughly take it as 5.
So, number of people preferring red colour is nearly 55.
Think, discuss and write
In the above example, the number of people who like red colour was taken as
50 + 5. If your friend wishes to take it as 50 + 8, is it acceptable?
Example 5 : A survey was carried out on 30 students of class VI in a school. Data about the different modes of transport used by them to travel to school was displayed as pictograph.
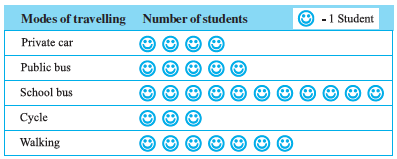
Solution : From the pictograph we find that:
(a) The number of students coming by private car is 4.
(b) Maximum number of students use the school bus. This is the most popular way.
(c) Cycle is used by only three students.
(d) The number of students using the other modes can be similarly found.
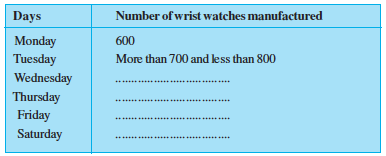
Example 6 : Following is the pictograph of the number of wrist watches manufactured by a factory in a particular week.
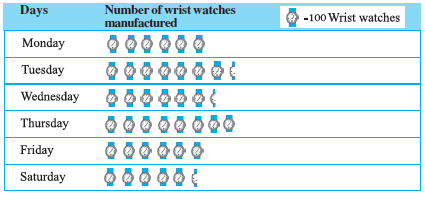
(a) On which day were the least number of wrist watches manufactured?
(b) On which day were the maximum number of wrist watches manufactured?
(c) Find out the approximate number of wrist watches manufactured in the particular week?
Solution : We can complete the following table and find the answers.
Exercise 9.1
1. In a Mathematics test, the following marks were obtained by 40 students. Arrange these marks in a table using tally marks.
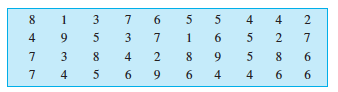
(a) Find how many students obtained marks equal to or more than 7.
(b) How many students obtained marks below 4?
2. Following is the choice of sweets of 30 students of Class VI.
Ladoo, Barfi, Ladoo, Jalebi, Ladoo, Rasgulla, Jalebi, Ladoo, Barfi, Rasgulla, Ladoo, Jalebi, Jalebi, Rasgulla, Ladoo, Rasgulla, Jalebi, Ladoo, Rasgulla, Ladoo, Ladoo, Barfi, Rasgulla, Rasgulla, Jalebi, Rasgulla, Ladoo, Rasgulla, Jalebi, Ladoo.
(a) Arrange the names of sweets in a table using tally marks.
(b) Which sweet is preferred by most of the students?
3. Catherine threw a dice 40 times and noted the number appearing each time as shown below :
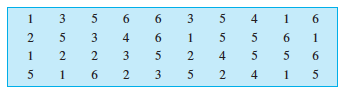
Make a table and enter the data using tally marks. Find the number that appeared.
(a) The minimum number of times (b) The maximum number of times
(c) Find those numbers that appear an equal number of times.
4. Following pictograph shows the number of tractors in five villages.
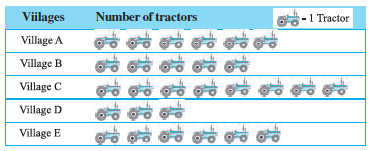
Observe the pictograph and answer the following questions.
(ii) Which village has the maximum number of tractors?
(iii) How many more tractors village C has as compared to village B.
(iv) What is the total number of tractors in all the five villages?
5. The number of girl students in each class of a co-educational middle school is depicted by the pictograph :
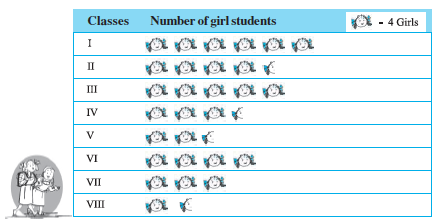
Observe this pictograph and answer the following questions :
(a) Which class has the minimum number of girl students?
(c) How many girls are there in Class VII?
6. The sale of electric bulbs on different days of a week is shown below :
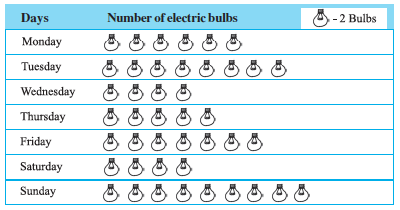
Observe the pictograph and answer the following questions :
(a) How many bulbs were sold on Friday?
(c) On which of the days same number of bulbs were sold?
(d) On which of the days minimum number of bulbs were sold?
(e) If one big carton can hold 9 bulbs. How many cartons were needed in the given week?
7. In a village six fruit merchants sold the following number of fruit baskets in a particular season :
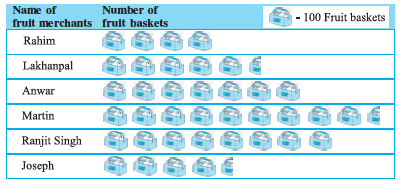
Observe this pictograph and answer the following questions :
(a) Which merchant sold the maximum number of baskets?
(c) The merchants who have sold 600 or more number of baskets are planning to buy a godown for the next season. Can you name them?
9.6 Drawing a Pictograph
Drawing a pictograph is interesting. But sometimes, a symbol like (which was used in one of the previous examples) may represent multiple units and may be difficult to draw. Instead of it we can use simpler symbols. If represents say 5 students, how will you represent, say, 4 or 3 students?
We can solve such a situation by making an assumption that — represents 5 students,  represents 4 students,
 represents 3 students,
  represents 2 students,
 represents 1 student, and then start the task of representation.
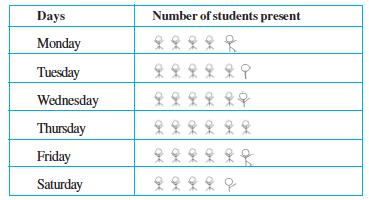
Example 7 : The following are the details of number of students present in a class of 30 during a week. Represent it by a pictograph.
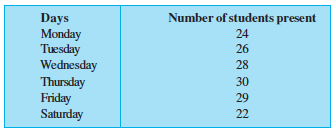
Solution : With the assumptions we have made earlier,
24 may be represented by
26 may be represented by and so on.
Thus, the pictograph would be
We had some sort of agreement over how to represent ‘less than 5’ by a picture. Such a sort of splitting the pictures may not be always possible. In such cases what shall we do?
Study the following example.
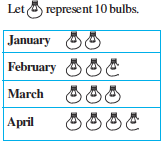
Example 8 : The following are the number of electric bulbs purchased for a lodging house during the first four months of a year.
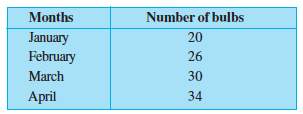
Represent the details by a pictograph.
Solution : Picturising for January and March is not difficult. But representing 26 and 34 with the pictures is not easy.
We may round off 26 to nearest 5 i.e. to 25 and 34 to 35. We then show two and a half bulbs for February and three and a half for April.
Exercise 9.2
1. Total number of animals in five villages are as follows :
Village A : 80 Village B : 120
Village C : 90 Village D : 40
Village E : 60
Prepare a pictograph of these animals using one symbol to represent 10 animals and answer the following questions :
(a) How many symbols represent animals of village E?
(b) Which village has the maximum number of animals?
(c) Which village has more animals : village A or village C?
2. Total number of students of a school in different years is shown in the following table
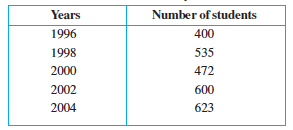
A. Prepare a pictograph of students using one symbol to represent 100 students and answer the following questions:
(a) How many symbols represent total number of students in the year 2002?
(b) How many symbols represent total number of students for the year 1998?
B. Prepare another pictograph of students using any other symbol each representing 50 students. Which pictograph do you find more informative?
9.7 A Bar Graph
Representing data by pictograph is not only time consuming but at times difficult too. Let us see some other way of representing data visually. Bars of uniform width can be drawn horizontally or vertically with equal spacing between them and then the length of each bar represents the given number. Such method of representing data is called a bar diagram or a bar graph.
9.7.1 Interpretation of a bar graph
Let us look at the example of vehicular traffic at a busy road crossing in Delhi, which was studied by the traffic police on a particular day. The number of vehicles passing through the crossing every hour from 6 a.m. to 12.00 noon is shown in the bar graph. One unit of length stands for 100 vehicles.
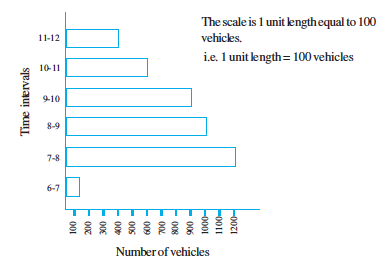
We can see that maximum traffic is shown by the longest bar (i.e. 1200 vehicles) for the time interval 7-8 a.m. The second longer bar is for 8-9 a.m. Similarly, minimum traffic is shown by the smallest bar (i.e. 100 vehicles) for the time interval 6-7 a.m. The bar just longer than the smallest bar is between
11 a.m. - 12 noon.
The total traffic during the two peak hours (8.00-10.00 am) as shown by the two long bars is 1000+900 = 1900 vehicles.
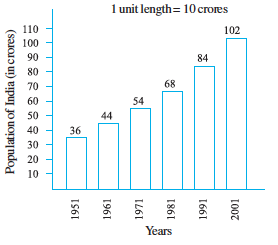
If the numbers in the data are large, then you may need a different scale.For example, take the case of the growth of the population of India. The numbers are in crores. So, if you take 1 unit length to be one person, drawing the bars will not be possible. Therefore, choose the scale as 1 unit to represents 10 crores. The bar graph for this case is shown in the figure.
So, the bar of length 5 units represents 50 crores and of 8 units represents 80 crores.
Number of students
Example 9 : Read the adjoining bar graph showing the number of students in a particular class of a school.
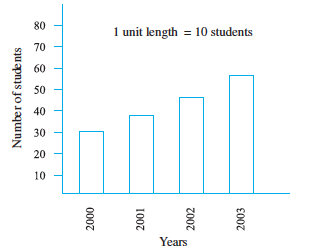
Answer the following questions :
(a) What is the scale of this graph?
(b) How many new students are added every year?
(c) Is the number of students in the year 2003 twice that in the year 2000?
Solution : (a) The scale is 1 unit length equals 10 students.
Try (b) and (c) for yourself.
Exercise 9.3
1. The bar graph given alongside shows the amount of wheat purchased by government during the year 1998-2002.
Wheat (in thousand tonnes)
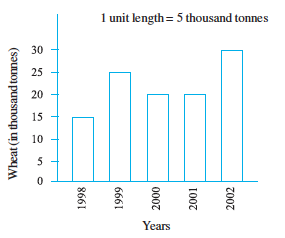
Read the bar graph and write down your observations. In which year was
(a) the wheat production maximum?
(b) the wheat production minimum?
2. Observe this bar graph which is showing the sale of shirts in a ready made shop from Monday to Saturday.
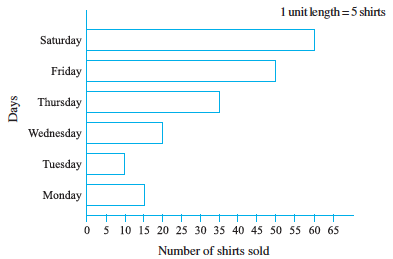
Now answer the following questions :
(a) What information does the above bar graph give?
(b) What is the scale chosen on the horizontal line representing number of shirts?
(c) On which day were the maximum number of shirts sold? How many shirts were sold on that day?
(d) On which day were the minimum number of shirts sold?
(e) How many shirts were sold on Thursday?
3. Observe this bar graph which shows the marks obtained by Aziz in half-yearly examination in different subjects.
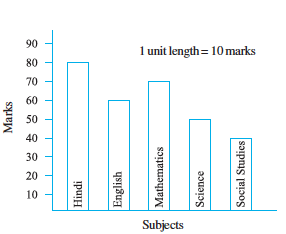
Answer the given questions.
(a) What information does the bar graph give?
(b) Name the subject in which Aziz scored maximum marks.
(c) Name the subject in which he has scored minimum marks.
(d) State the name of the subjects and marks obtained in each of them.
9.7.2 Drawing a bar graph
Recall the example where Ronald (section 9.3) had prepared a table representing choice of fruits made by his classmates. Let us draw a bar graph for this data.
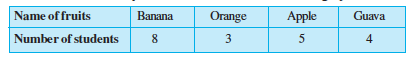
First of all draw a horizontal line and a vertical line. On the horizontal line we will draw bars representing each fruit and on vertical line we will write numerals representing number of students.
Let us choose a scale. It means we first decide how many students will be represented by unit length of a bar.
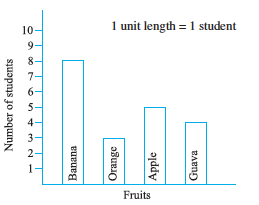
Here, we take 1 unit length to represent 1 student only.
We get a bar graph as shown in adjoining figure.
Example 10 : Following table shows the monthly expenditure of Imran’s family on various items.
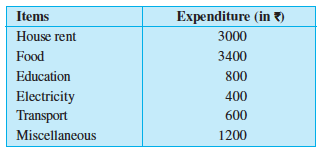
To represent this data in the form of a bar diagram, here are the steps.
(a) Draw two perpendicular lines, one vertical and one horizontal.
(b) Along the horizontal line, mark the ‘items’ and along the vertical line, mark the corresponding expenditure.
(c) Take bars of same width keeping uniform gap between them.
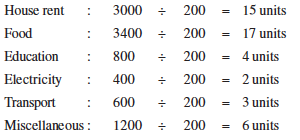
(d) Choose suitable scale along the vertical line. Let 1 unit length = ` 200 and then mark the corresponding values.
Calculate the heights of the bars for various items as shown below.
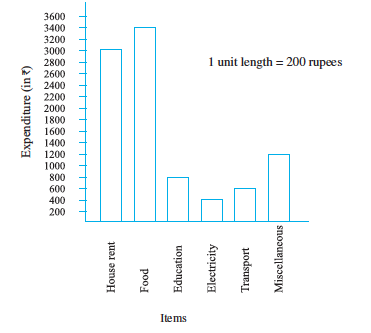
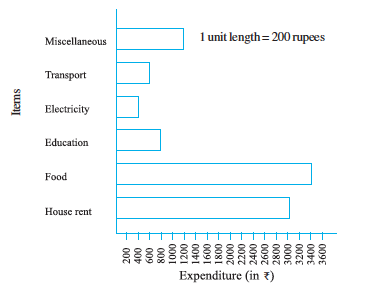
Same data can be represented by interchanging positions of items and expenditure as shown below :
![]()
1. Along with your friends, think of five more situations where we can have data.
For this data, construct the tables and represent them using bar graphs.
Exercise 9.4
1. A survey of 120 school students was done to find which activity they prefer to do in their free time.
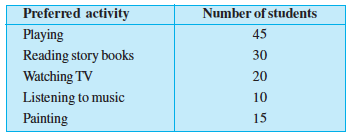
Draw a bar graph to illustrate the above data taking scale of 1 unit
length = 5 students.
Which activity is preferred by most of the students other than playing?
2. The number of Mathematics books sold by a shopkeeper on six consecutive days is shown below :
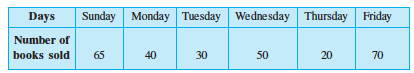
Draw a bar graph to represent the above information choosing the scale of your choice.
3. Following table shows the number of bicycles manufactured in a factory during the years 1998 to 2002. Illustrate this data using a bar graph. Choose a scale of your choice.
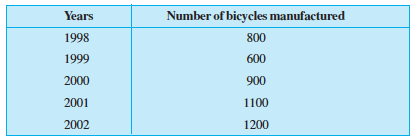
(a) In which year were the maximum number of bicycles manufactured?
(b) In which year were the minimum number of bicycles manufactured?
4. Number of persons in various age groups in a town is given in the following table.
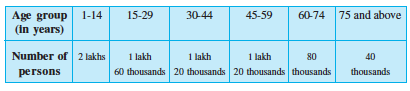
Draw a bar graph to represent the above information and answer the following questions. (take 1 unit length = 20 thousands)
(a) Which two age groups have same population?
(b) All persons in the age group of 60 and above are called senior citizens. How many senior citizens are there in the town?
What have we discussed?
1. We have seen that data is a collection of numbers gathered to give some information.
2. To get a particular information from the given data quickly, the data can be arranged in a tabular form using tally marks.
3. We learnt how a pictograph represents data in the form of pictures, objects or parts of objects. We have also seen how to interpret a pictograph and answer the related questions. We have drawn pictographs using symbols to represent a certain number of items or things. For example, = 100 books.
4. We have discussed how to represent data by using a bar diagram or a bar graph. In a bar graph, bars of uniform width are drawn horizontally or vertically with equal spacing between them. The length of each bar gives the required information.
5. To do this we also discussed the process of choosing a scale for the graph.
For example, 1 unit = 100 students. We have also practised reading a given bar graph. We have seen how interpretations from the same can be made.