Table of Contents

Chapter 3
Data Handling
3.1 Introduction
In your previous classes, you have dealt with various types of data. You have learnt to collect data, tabulate and put it in the form of bar graphs. The collection, recording and presentation of data help us organise our experiences and draw inferences from them. In this Chapter, we will take one more step towards learning how to do this. You will come across some more kinds of data and graphs. You have seen several kinds of data through newspapers, magazines, television and other sources. You also know that all data give us some sort of information. Let us look at some common forms of data that you come across:
What do these collections of data tell you?
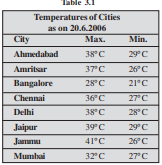
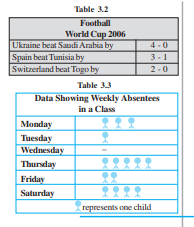
For example you can say that the highest maximum temperature was in Jammu on 20.06.2006 (Table 3.1) or we can say that, on Wednesday, no child was absent.
(Table 3.3)
Can we organise and present these data in a different way, so that their analysis and interpretation becomes better? We shall address such questions in this Chapter.
3.2 Collecting Data
The data about the temperatures of cities (Table 3.1) can tell us many things, but it cannot tell us the city which had the highest maximum temperature during the year. To find that, we need to collect data regarding the highest maximum temperature reached in each of these cities during the year. In that case, the temperature chart of one particular date of the year, as given in Table 3.1 will not be sufficient.
This shows that a given collection of data may not give us a specific information related to that data. For this we need to collect data keeping in mind that specific information. In the above case the specific information needed by us, was about the highest maximum temperature of the cities during the year, which we could not get from Table 3.1
Thus, before collecting data, we need to know what we would use it for.
Given below are a few situations.
You want to study the
– Performance of your class in Mathematics.
– Performance of India in football or in cricket.
– Female literacy rate in a given area, or
– Number of children below the age of five in the families around you.
What kind of data would you need in the above situations? Unless and until you collect appropriate data, you cannot know the desired information. What is the appropriate data for each?
Discuss with your friends and identify the data you would need for each. Some of this data is easy to collect and some difficult.
3.3 Organisation of Data
When we collect data, we have to record and organise it. Why do we need to do that? Consider the following example.
Ms Neelam, class teacher wanted to find how children had performed in English. She writes down the marks obtained by the students in the following way:
23, 35, 48, 30, 25, 46, 13, 27, 32, 38
In this form, the data was not easy to understand. She also did not know whether her impression of the students matched their performance.
Neelam’s colleague helped her organise the data in the following way (Table 3.4).
Table 3.4
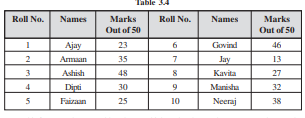
In this form, Neelam was able to know which student has got how many marks. But she wanted more. Deepika suggested another way to organise this data (Table 3.5).
Table 3.5
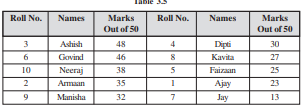
Now Neelam was able to see who had done the best and who needed help.
Many kinds of data we come across are put in tabular form. Our school rolls, progress report, index in the notebooks, temperature record and many others are all in tabular form. Can you think of a few more data that you come across in tabular form?
When we put data in a proper table it becomes easy to understand and interpret.
Weigh (in kg) atleast 20 children (girls and boys) of your class. Organise the data, and answer the following questions using this data.
(i) Who is the heaviest of all? (ii) What is the most common weight?

(iii) What is the difference between your weight and that of your best friend?
3.4 Representative Values
You might be aware of the term average and would have come across statements involving the term ‘average’ in your day-to-day life:
Isha spends on an average of about 5 hours daily for her studies.
The average temperature at this time of the year is about 40 degree celsius.
The average age of pupils in my class is 12 years.
The average attendance of students in a school during its final examination was
98 per cent.
Many more of such statements could be there. Think about the statements given above.
Do you think that the child in the first statement studies exactly for 5 hours daily?
Or, is the temperature of the given place during that particular time always 40 degrees?
Or, is the age of each pupil in that class 12 years? Obviously not.
Then what do these statements tell you?
By average we understand that Isha, usually, studies for 5 hours. On some days, she may study for less number of hours and on the other days she may study longer.
Similarly, the average temperature of 40 degree celsius, means that, very often, the temperature at this time of the year is around 40 degree celsius. Sometimes, it may be less than 40 degree celsius and at other times, it may be more than 40°C.
Thus, we realise that average is a number that represents or shows the central tendency of a group of observations or data. Since average lies between the highest and the lowest value of the given data so, we say average is a measure of the central tendency of the group of data. Different forms of data need different forms of representative or central value to describe it. One of these representative values is the “Arithmetic mean”. You will learn about the other representative values in the later part of the chapter.
3.5 Arithmetic Mean
The most common representative value of a group of data is the arithmetic mean or the mean. To understand this in a better way, let us look at the following example:
Two vessels contain 20 litres and 60 litres of milk respectively. What is the amount that each vessel would have, if both share the milk equally? When we ask this question we are seeking the arithmetic mean.
In the above case, the average or the arithmetic mean would be
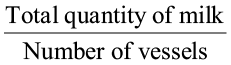 =
=  litres = 40 litres.
Thus, each vessels would have 40 litres of milk.
The average or Arithmetic Mean (A.M.) or simply mean is defined as follows:
mean = 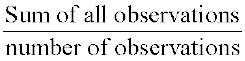
Consider these examples.
Example 1
Ashish studies for 4 hours, 5 hours and 3 hours respectively on three consecutive days. How many hours does he study daily on an average?
Solution
The average study time of Ashish would be
 =
=  hours = 4 hours per day
Thus, we can say that Ashish studies for 4 hours daily on an average.
Example 2
A batsman scored the following number of runs in six innings:
36, 35, 50, 46, 60, 55
Calculate the mean runs scored by him in an inning.

Solution
Total runs = 36 + 35 + 50 + 46 + 60 + 55 = 282.
To find the mean, we find the sum of all the observations and divide it by the number of observations.
Therefore, in this case, mean =  = 47. Thus, the mean runs scored in an inning are 47.
Where does the arithmetic mean lie
Think, Discuss and Write

Consider the data in the above examples and think on the following:
Is the mean bigger than each of the observations?
Is it smaller than each observation?
Discuss with your friends. Frame one more example of this type and answer the same questions.
You will find that the mean lies inbetween the greatest and the smallest observations.
In particular, the mean of two numbers will always lie between the two numbers. For example the mean of 5 and 11 is  , which lies between 5 and 11.
Can you use this idea to show that between any two fractional numbers, you can find as many fractional numbers as you like. For example between  and
and  you have their average
  =
=  and then between and , you have their average
and so on.

1. Find the mean of your sleeping hours during one week.
2. Find atleast 5 numbers between and  .
.
3.5.1 Range
The difference between the highest and the lowest observation gives us an idea of the spread of the observations. This can be found by subtracting the lowest observation from the highest observation. We call the result the range of the observation. Look at the following example:
Example 3
The ages in years of 10 teachers of a school are:
32, 41, 28, 54, 35, 26, 23, 33, 38, 40
(i) What is the age of the oldest teacher and that of the youngest teacher?
(ii) What is the range of the ages of the teachers?
(iii) What is the mean age of these teachers?
Solution
(i) Arranging the ages in ascending order, we get:
23, 26, 28, 32, 33, 35, 38, 40, 41, 54
We find that the age of the oldest teacher is 54 years and the age of the youngest teacher is 23 years.
(ii) Range of the ages of the teachers = (54 – 23) years = 31 years
(iii) Mean age of the teachers
= 
=  = 35 years
Exercise 3.1

1. Find the range of heights of any ten students of your class.
2. Organise the following marks in a class assessment, in a tabular form.
4, 6, 7, 5, 3, 5, 4, 5, 2, 6, 2, 5, 1, 9, 6, 5, 8, 4, 6, 7
(i) Which number is the highest? (ii) Which number is the lowest?
(iii) What is the range of the data? (iv) Find the arithmetic mean.
3. Find the mean of the first five whole numbers.
4. A cricketer scores the following runs in eight innings:
58, 76, 40, 35, 46, 45, 0, 100.
Find the mean score.
5. Following table shows the points of each player scored in four games:
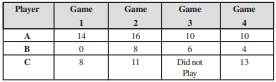
Now answer the following questions:
(i) Find the mean to determine A’s average number of points scored per game.
(ii) To find the mean number of points per game for C, would you divide the total points by 3 or by 4? Why?
(iii) B played in all the four games. How would you find the mean?
(iv) Who is the best performer?
6. The marks (out of 100) obtained by a group of students in a science test are 85, 76, 90, 85, 39, 48, 56, 95, 81 and 75. Find the:
(i) Highest and the lowest marks obtained by the students.
(ii) Range of the marks obtained.
(iii) Mean marks obtained by the group.
7. The enrolment in a school during six consecutive years was as follows:
1555, 1670, 1750, 2013, 2540, 2820
Find the mean enrolment of the school for this period.
8. The rainfall (in mm) in a city on 7 days of a certain week was recorded as follows:
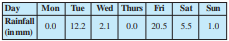
(i) Find the range of the rainfall in the above data.
(ii) Find the mean rainfall for the week.
(iii) On how many days was the rainfall less than the mean rainfall.
9. The heights of 10 girls were measured in cm and the results are as follows:
135, 150, 139, 128, 151, 132, 146, 149, 143, 141.
(i) What is the height of the tallest girl? (ii) What is the height of the shortest girl?
(iii) What is the range of the data? (iv) What is the mean height of the girls?
(v) How many girls have heights more than the mean height.
3.6 Mode
As we have said Mean is not the only measure of central tendency or the only form of representative value. For different requirements from a data, other measures of central tendencies are used.
Look at the following example
To find out the weekly demand for different sizes of shirt, a shopkeeper kept records of sales of sizes 90 cm, 95 cm, 100 cm, 105 cm, 110 cm. Following is the record for a week:
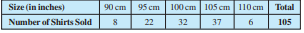
If he found the mean number of shirts sold, do you think that he would be able to decide which shirt sizes to keep in stock?
Mean of total shirts sold = 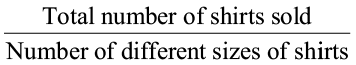
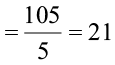
Should he obtain 21 shirts of each size? If he does so, will he be able to cater to the needs of the customers?
The shopkeeper, on looking at the record, decides to procure shirts of sizes 95 cm, 100 cm, 105 cm. He decided to postpone the procurement of the shirts of other sizes because of their small number of buyers.
Look at another example
The owner of a readymade dress shop says, “The most popular size of dress I sell is the size 90 cm.
Observe that here also, the owner is concerned about the number of shirts of different sizes sold. She is however looking at the shirt size that is sold the most. This is another representative value for the data. The highest occuring event is the sale of size 90 cm.This representative value is called the mode of the data.
The mode of a set of observations is the observation that occurs most often.
Example 4 Find the mode of the given set of numbers: 1, 1, 2, 4, 3, 2, 1, 2, 2, 4
Solution Arranging the numbers with same values together, we get
1, 1, 1, 2, 2, 2, 2, 3, 4, 4
Mode of this data is 2 because it occurs more frequently than other observations.
3.6.1 Mode of Large Data
Putting the same observations together and counting them is not easy if the number of observations is large. In such cases we tabulate the data. Tabulation can begin by putting tally marks and finding the frequency, as you did in your previous class.
Try These
Find the mode of
(i) 2, 6, 5, 3, 0, 3, 4, 3, 2, 4, 5, 2, 4
(ii) 2, 14, 16, 12, 14, 14, 16, 14, 10, 14, 18, 14
Look at the following example:
Example 5
Following are the margins of victory in the football matches of a league.
1, 3, 2, 5, 1, 4, 6, 2, 5, 2, 2, 2, 4, 1, 2, 3, 1, 1, 2, 3, 2,
6, 4, 3, 2, 1, 1, 4, 2, 1, 5, 3, 3, 2, 3, 2, 4, 2, 1, 2
Find the mode of this data.
Solution
Let us put the data in a tabular form:
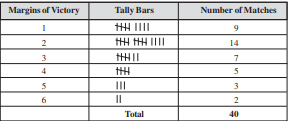
Looking at the table, we can quickly say that 2 is the ‘mode’ since 2 has occured the highest number of times. Thus, most of the matches have been won with a victory margin of 2 goals.
Think, Discuss and Write
Can a set of numbers have more than one mode?
Example 6
Find the mode of the numbers: 2, 2, 2, 3, 3, 4, 5, 5, 5, 6, 6, 8
Solution
Here, 2 and 5 both occur three times. Therefore, they both are modes of the data.
DO THIS
1. Record the age in years of all your classmates. Tabulate the data and find the mode.
2. Record the heights in centimetres of your classmates and find the mode.

1. Find the mode of the following data:
12, 14, 12, 16, 15, 13, 14, 18, 19, 12, 14, 15, 16, 15, 16, 16, 15,
17, 13, 16, 16, 15, 15, 13, 15, 17, 15, 14, 15, 13, 15, 14
2. Heights (in cm) of 25 children are given below:
168, 165, 163, 160, 163, 161, 162, 164, 163, 162, 164, 163, 160, 163, 160, 165, 163, 162, 163, 164, 163, 160, 165, 163, 162
What is the mode of their heights? What do we understand by mode here?
Whereas mean gives us the average of all observations of the data, the mode gives that observation which occurs most frequently in the data.
Let us consider the following examples:
(a) You have to decide upon the number of chapattis needed for 25 people called for a feast.
(b) A shopkeeper selling shirts has decided to replenish her stock.
(c) We need to find the height of the door needed in our house.
(d) When going on a picnic, if only one fruit can be bought for everyone, which is the fruit that we would get.
In which of these situations can we use the mode as a good estimate?
Consider the first statement. Suppose the number of chapattis needed by each person is 2, 3, 2, 3, 2, 1, 2, 3, 2, 2, 4, 2, 2, 3, 2, 4, 4, 2, 3, 2, 4, 2, 4, 3, 5
The mode of the data is 2 chapattis. If we use mode as the representative value for this data, then we need 50 chapattis only, 2 for each of the 25 persons. However the total number would clearly be inadequate. Would mean be an appropriate representative value?
For the third statement the height of the door is related to the height of the persons using that door. Suppose there are 5 children and 4 adults using the door and the height of each of 5 children is around 135 cm. The mode for the heights is 135 cm. Should we get a door that is 144 cm high? Would all the adults be able to go through that door? It is clear that mode is not the appropriate representative value for this data. Would mean be an appropriate representative value here?
Why not? Which representative value of height should be used to decide the doorheight?

Similarly analyse the rest of the statements and find the representative value useful for that issue.
Discuss with your friends and give
(a) Two situations where mean would be an appropriate representative value to use, and
(b) Two situations where mode would be an appropriate representative value to use.
3.7 Median
We have seen that in some situations, arithmetic mean is an appropriate measure of central tendency whereas in some other situations, mode is the appropriate measure of central tendency.
Let us now look at another example. Consider a group of 17 students with the following heights (in cm): 106, 110, 123, 125, 117, 120, 112, 115, 110, 120, 115, 102, 115, 115, 109, 115, 101.
The games teacher wants to divide the class into two groups so that each group has equal number of students, one group has students with height lesser than a particular height and the other group has students with heights greater than the particular height. How would she do that?
Let us see the various options she has:
(i) She can find the mean. The mean is

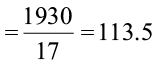
So, if the teacher divides the students into two groups on the basis of this mean height, such that one group has students of height less than the mean height and the other group has students with height more than the mean height, then the groups would be of unequal size. They would have 7 and 10 members respectively.
(ii) The second option for her is to find mode. The observation with highest frequency is 115 cm, which would be taken as mode.
There are 7 children below the mode and 10 children at the mode and above the mode. Therefore, we cannot divide the group into equal parts.
Let us therefore think of an alternative representative value or measure of central tendency. For doing this we again look at the given heights (in cm) of students and arrange them in ascending order. We have the following observations:
101, 102, 106, 109, 110, 110, 112, 115, 115, 115, 115, 115, 117, 120, 120, 123, 125
The middle value in this data is 115 because this value divides the students into two equal groups of 8 students each. This value is called as Median. Median refers to the value which lies in the middle of the data (when arranged in an increasing or decreasing order) with half of the observations above it and the other half below it. The games teacher decides to keep the middle student as a refree in the game.
Here, we consider only those cases where number of observations is odd.
Thus, in a given data, arranged in ascending or descending order, the median gives us the middle observation.
Note that in general, we may not get the same value for median and mode.
Thus we realise that mean, mode and median are the numbers that are the representative values of a group of observations or data. They lie between the minimum and maximum values of the data. They are also called the measures of the central tendency.

Example 7
Find the median of the data: 24, 36, 46, 17, 18, 25, 35
Solution We arrange the data in ascending order, we get 17, 18, 24, 25, 35, 36, 46 Median is the middle observation. Therefore 25 is the median.
Exercise 3.2
1. The scores in mathematics test (out of 25) of 15 students is as follows:
19, 25, 23, 20, 9, 20, 15, 10, 5, 16, 25, 20, 24, 12, 20
Find the mode and median of this data. Are they same?
2. The runs scored in a cricket match by 11 players is as follows:
6, 15, 120, 50, 100, 80, 10, 15, 8, 10, 15
Find the mean, mode and median of this data. Are the three same?
3. The weights (in kg.) of 15 students of a class are:
38, 42, 35, 37, 45, 50, 32, 43, 43, 40, 36, 38, 43, 38, 47
(i) Find the mode and median of this data.
(ii) Is there more than one mode?
4. Find the mode and median of the data: 13, 16, 12, 14, 19, 12, 14, 13, 14
5. Tell whether the statement is true or false:
(i) The mode is always one of the numbers in a data.
(ii) The mean is one of the numbers in a data.
(iii) The median is always one of the numbers in a data.
(iv) The data 6, 4, 3, 8, 9, 12, 13, 9 has mean 9.
3.8 Use of Bar Graphs with a Different Purpose
We have seen last year how information collected could be first arranged in a frequency distribution table and then this information could be put as a visual representation in the form of pictographs or bar graphs. You can look at the bar graphs and make deductions about the data. You can also get information based on these bar graphs. For example, you can say that the mode is the longest bar if the bar represents the frequency.
3.8.1 Choosing a Scale
We know that a bar graph is a representation of numbers using bars of uniform width and the lengths of the bars depend upon the frequency and the scale you have chosen. For example, in a bar graph where numbers in units are to be shown, the graph represents one unit length for one observation and if it has to show numbers in tens or hundreds, one unit length can represent 10 or 100 observations. Consider the following examples:
Example 8
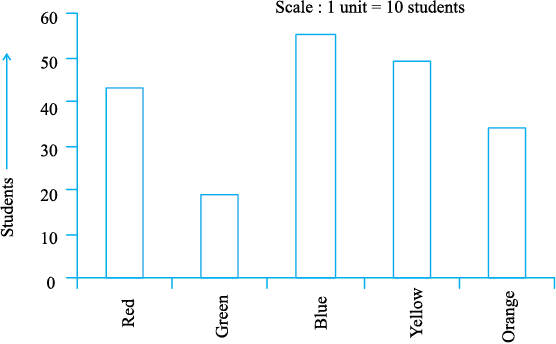
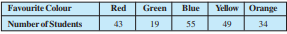
Two hundred students of 6th and 7th classes were asked to name their favourite colour so as to decide upon what should be the colour of their school building. The results are shown in the following table. Represent the given data on a bar graph.
Answer the following questions with the help of the bar graph:
(i) Which is the most preferred colour and which is the least preferred?
(ii) How many colours are there in all? What are they?
Solution
Choose a suitable scale as follows:
Start the scale at 0. The greatest value in the data is 55, so end the scale at a value greater than 55, such as 60. Use equal divisions along the axes, such as increments of 10. You know that all the bars would lie between 0 and 60. We choose the scale such that the length between 0 and 60 is neither too long nor too small. Here we take 1 unit for 10 students.
We then draw and label the graph as shown.

From the bar graph we conclude that
(i) Blue is the most preferred colour (Because the bar representing Blue is the tallest).
(ii) Green is the least preferred colour. (Because the bar representing Green is the shortest).
(iii) There are five colours. They are Red, Green, Blue, Yellow and Orange. (These are observed on the horizontal line)
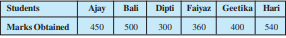
Example 9
Following data gives total marks (out of 600) obtained by six children of a particular class. Represent the data on a bar graph.
Solution
(i) To choose an appropriate scale we make equal divisions taking increments of 100. Thus 1 unit will represent 100 marks. (What would be the difficulty if we choose one unit to represent 10 marks?)
(ii) Now represent the data on the bar graph.

Drawing double bar graph
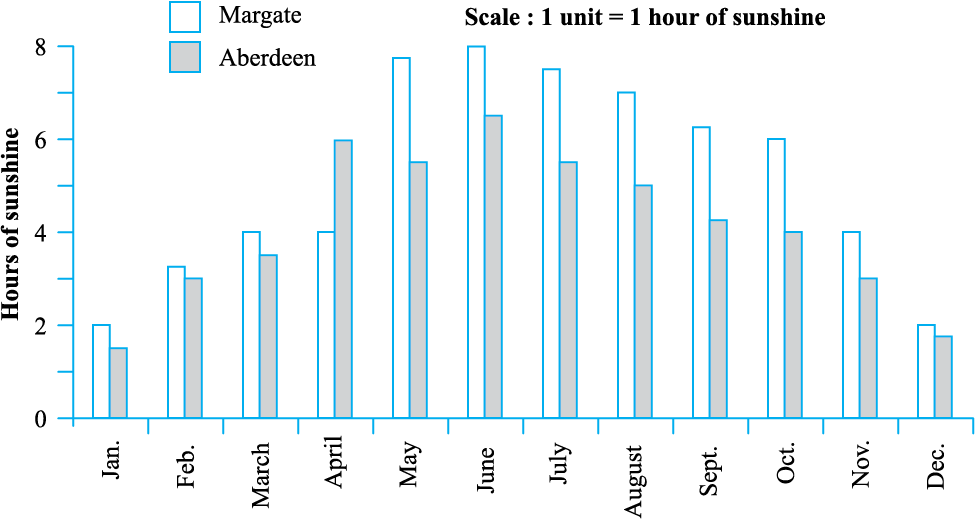
Consider the following two collections of data giving the average daily hours of sunshine in two cities Aberdeen and Margate for all the twelve months of the year. These cities are near the south pole and hence have only a few hours of sunshine each day.
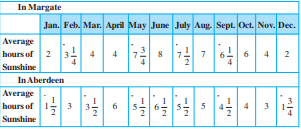
By drawing individual bar graphs you could answer questions like
(i) In which month does each city has maximum sunlight? or
(ii) In which months does each city has minimum sunlight?
However, to answer questions like “In a particular month, which city has more sunshine hours”, we need to compare the average hours of sunshine of both the cities. To do this we will learn to draw what is called a double bar graph giving the information of both cities side-by-side.
This bar graph (Fig 3.1) shows the average sunshine of both the cities.

For each month we have two bars, the heights of which give the average hours of sunshine in each city. From this we can infer that except for the month of April, there is always more sunshine in Margate than in Aberdeen. You could put together a similiar bar graph for your area or for your city.
Let us look at another example more related to us.
Example 10
A mathematics teacher wants to see, whether the new technique of teaching she applied after quarterly test was effective or not. She takes the scores of the 5 weakest children in the quarterly test (out of 25) and in the half yearly test (out of 25):
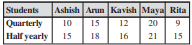
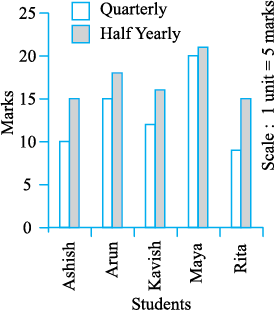
Fig 3.2
Students Ashish Arun Kavish Maya Rita
Quarterly 10 15 12 20 9
Half yearly 15 18 16 21 15
Solution
She draws the adjoining double bar graph and finds a marked improvement in most of the students, the teacher decides that she should continue to use the new technique of teaching.
Can you think of a few more situations where you could use double bar graphs?
1. The bar graph (Fig 3.2) shows the result of a survey to test water resistant watches made by different companies.
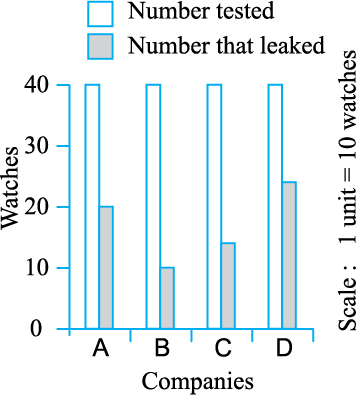
Fig 3.3
Each of these companies claimed that their watches were water resistant. After a test the above results were revealed.
(a) Can you work out a fraction of the number of watches that leaked to the number tested for each company?
(b) Could you tell on this basis which company has better watches?
2. Sale of English and Hindi books in the years 1995, 1996, 1997 and 1998 are given below:
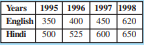
Draw a double bar graph and answer the following questions:
(a) In which year was the difference in the sale of the two language books least?.
(b) Can you say that the demand for English books rose faster? Justify.
Exercise 3.3
1. Use the bar graph (Fig 3.3) to answer the following questions.
(a) Which is the most popular pet? (b) How many students have dog as a pet?
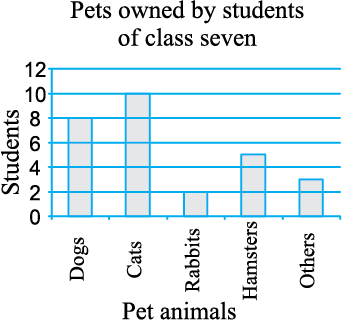
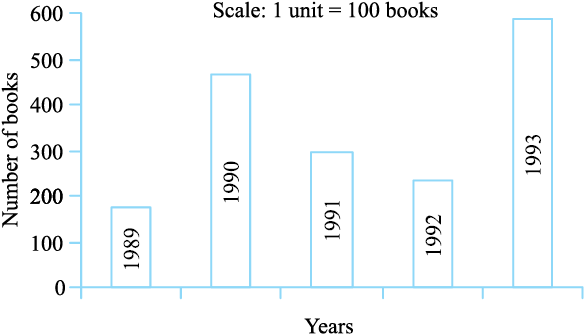
Fig 3.4
2. Read the bar graph (Fig 3.4) which shows the number of books sold by a bookstore during five consecutive years and answer the following questions:
(i) About how many books were sold in 1989? 1990? 1992?
(ii) In which year were about 475 books sold? About 225 books sold?
(iii) In which years were fewer than 250 books sold?
(iv) Can you explain how you would estimate the number of books sold in 1989?
3. Number of children in six different classes are given below. Represent the data on a bar graph.
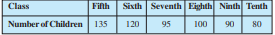
(a) How would you choose a scale?
(b) Answer the following questions:

(i) Which class has the maximum number of children? And the minimum?
(ii) Find the ratio of students of class sixth to the students of class eight.
4. The performance of a student in 1st Term and 2nd Term is given. Draw a double bar graph choosing appropriate scale and answer the following:
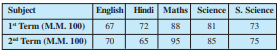
(i) In which subject, has the child improved his performance the most?
(ii) In which subject is the improvement the least?
(iii) Has the performance gone down in any subject?
5. Consider this data collected from a survey of a colony.
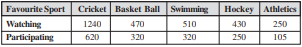
Favourite Sport Cricket Basket Ball Swimming Hockey Athletics
Watching 1240 470 510 430 250
Participating 620 320 320 250 105
(i) Draw a double bar graph choosing an appropriate scale.
What do you infer from the bar graph?
(ii) Which sport is most popular?
(iii) Which is more preferred, watching or participating in sports?
6. Take the data giving the minimum and the maximum temperature of various cities given in the beginning of this Chapter (Table 3.1). Plot a double bar graph using the data and answer the following:
(i) Which city has the largest difference in the minimum and maximum temperature on the given date?
(ii) Which is the hottest city and which is the coldest city?
(iii) Name two cities where maximum temperature of one was less than the minimum temperature of the other.
(iv) Name the city which has the least difference between its minimum and the maximum temperature.
Try These
Think of some situations, atleast 3 examples of each, that are certain to happen, some that are impossible and some that may or may not happen i.e., situations that have some chance of happening.
3.9 Chance and Probability

These words often come up in our daily life. We often say, “there is no chance of it raining today” and also say things like “it is quite probable that India will win the World Cup.” Let us try and understand these terms a bit more. Consider the
statements;
(i) The Sun coming up from the West (ii) An ant growing to 3 m height.
(iii) If you take a cube of larger volume its side will also be larger.
(iv) If you take a circle with larger area then it’s radius will also be larger.
(v) India winning the next test series.
If we look at the statements given above you would say that the Sun coming up from the West is impossible, an ant growing to 3 m is also not possible. On the other hand if the circle is of a larger area it is certain that it will have a larger radius. You can say the same about the larger volume of the cube and the larger side. On the other hand India can win the next test series or lose it. Both are possible.
3.9.1 Chance
If you toss a coin, can you always correctly predict what you will get? Try tossing a coin and predicting the outcome each time. Write your observations in the following table:
Do this 10 times. Look at the observed outcomes. Can you see a pattern in them? What do you get after each head? Is it that you get head all the time? Repeat the observation for another 10 tosses and write the observations in the table.
You will find that the observations show no clear pattern. In the table below we give you observations generated in 25 tosses by Sushila and Salma. Here H represents Head and T represents Tail.
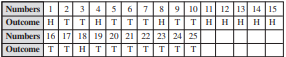
What does this data tell you? Can you find a predictable pattern for head and tail? Clearly there is no fixed pattern of occurrence of head and tail. When you throw the coin each time the outcome of every throw can be either head or tail. It is a matter of chance that in one particular throw you get either of these.

In the above data, count the number of heads and the number of tails. Throw the coin some more times and keep recording what you obtain. Find out the total number of times you get a head and the total number of times you get a tail.
You also might have played with a die. The die has six faces. When you throw a die, can you predict the number that will be obtained? While playing ludo or snake and ladders you may have often wished that in a throw you get a particular outcome.
Does the die always fall according to your wishes? Take a die and throw it 150 times and fill the data in the following table:
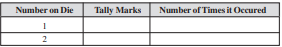
Make a tally mark each time you get the outcome, against the appropriate number. For example in the first throw you get 5. Put a tally in front of 5. The next throw gives you 1. Make a tally for 1. Keep on putting tally marks for the appropriate number. Repeat this exercise for 150 throws and find out the number of each outcome for 150 throws.
Make bar graph using the above data showing the number of times 1, 2, 3, 4, 5, 6 have occured in the data.
Try These
(Do in a group)
1. Toss a coin 100 times and record the data. Find the number of times heads and tails occur in it.
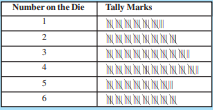
2. Aftaab threw a die 250 times and got the following table. Draw a bar graph for this data.
3. Throw a die 100 times and record the data. Find the number of times 1, 2, 3, 4, 5, 6 occur.

What is probability?
We know that when a coin is thrown, it has two possible outcomes, Head or Tail and for a die we have 6 possible outcomes. We also know from experience that for a coin, Head or Tail is equally likely to be obtained. We say that the probability of getting Head or Tail is equal and is  for each.
For a die, possibility of getting either of 1, 2, 3, 4, 5 or 6 is equal. That is for a die there are 6 equally likely possible outcomes. We say each of 1, 2, 3, 4, 5, 6 has one-sixth ( ) probability. We will learn about this in the later classes. But from what we have done, it may perhaps be obvious that events that have many possibilities can have probability between 0 and 1. Those which have no chance of happening have probability 0 and those that are bound to happen have probability 1.
Given any situation we need to understand the different possible outcomes and study the possible chances for each outcome. It may be possible that the outcomes may not have equal chance of occuring unlike the cases of the coin and die. For example, if a container has 15 red balls and 9 white balls and if a ball is pulled out without seeing, the chances of getting a red ball are much more. Can you see why? How many times are the chances of getting a red ball than getting a white ball, probabilities for both being between 0 and 1.
Exercise 3.4
1. Tell whether the following is certain to happen, impossible, can happen but not certain.
(i) You are older today than yesterday. (ii) A tossed coin will land heads up.
(iii) A die when tossed shall land up with 8 on top.
(iv) The next traffic light seen will be green. (v) Tomorrow will be a cloudy day.
2. There are 6 marbles in a box with numbers from 1 to 6 marked on each of them.
(i) What is the probability of drawing a marble with number 2?
(ii) What is the probability of drawing a marble with number 5?
3. A coin is flipped to decide which team starts the game. What is the probability that your team will start?
What have We Discussed?
1. The collection, recording and presentation of data help us organise our experiences and draw inferences from them.
2. Before collecting data we need to know what we would use it for.
3. The data that is collected needs to be organised in a proper table, so that it becomes easy to understand and interpret.
4. Average is a number that represents or shows the central tendency of a group of observations or data.
5. Arithmetic mean is one of the representative values of data.
6. Mode is another form of central tendency or representative value. The mode of a set of observations is the observation that occurs most often.
7. Median is also a form of representative value. It refers to the value which lies in the middle of the data with half of the observations above it and the other half below it.
8. A bar graph is a representation of numbers using bars of uniform widths.
9. Double bar graphs help to compare two collections of data at a glance.
10. There are situations in our life, that are certain to happen, some that are impossible and some that may or may not happen. The situation that may or may not happen has a chance of happening.
