Table of Contents

Chapter 2:
Introduction to Linear Polynomials
2.1 Introduction
We have learnt about algebraic expressions in earlier grades. In this chapter, we will learn about the special types of algebraic expressions called linear polynomials. Let us first consider a few examples of algebraic expressions.

Example 1: Raju went to a shop where there were sealed boxes of different colours on sale. The shop owner told him that the red boxes have 4 pens each and the blue boxes have 5 pencils each. Now, if Raju bought x red boxes and y blue boxes, how can he quickly figure out the total quantity of pens and pencils? Also, if he got 3 extra pens free, how many pens and pencils did he get altogether?
Observe that x red boxes will have 4x pens and y blue boxes will have 5y pencils. Also, he got 3 extra pens free. Thus, the total number of pens and pencils is given by the algebraic expression 4x + 5y + 3.
In this example, 4x, 5y and 3 are terms of the expression, x and y are letter-numbers, the numbers 4 and 5 are the coefficients of x and y, respectively, and 3 is a constant. From now onwards, we will use a widely used alternate word for letter-numbers: variables. Thus in the expression 4x + 5y + 3, we say that the variables used are x and y.
Example 2: A rectangular garden of length l metres and width w metres has to be fenced and decorated. A wire fence is to be laid along the length costing `100 per metre and a wooden fence is to be built along the width costing `80 per metre. Special seeds have to be sown throughout the garden which will cost `50 per square metre.
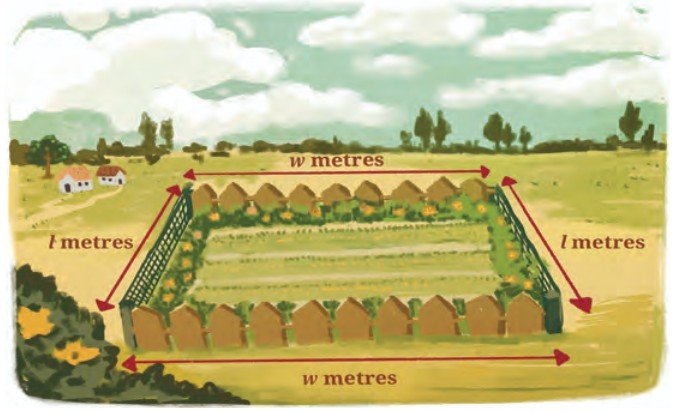
What will be the total cost incurred?
Cost of wire fencing along the garden length = 2l × 100 = ₹200l Cost of wooden fencing along the garden width = 2w × 80 = ₹160w Cost of sowing seeds throughout the entire garden (depends on the area) = 50 × l × w = ₹50lw
Total cost = ₹(200l + 160w + 50lw).
Thus, 200l + 160w + 50lw is the algebraic expression for the total cost.
| Think and Reflect | |
|---|---|
| 1 | Can you identify the terms, variables and coefficients of this algebraic expression? |
| 2 | How is it different from the algebraic expression in Example 1? |
Example 3: A wire of length 20 cm is bent in different ways to form rectangles. For example, we can have a rectangle with length 7 cm and width 3 cm. We can also have one of length 5.5 cm and width 4.5 cm. (Think of a few more ways of forming such rectangles.) Can you write an expression for the area of such rectangles?
If the length of the rectangle is x cm, then the width is (10 – x) cm. The expression for the area of these rectangles is x(10 – x) or 10x – x2.
| Think and Reflect | |
|---|---|
| 1 | Can you identify the terms, variables and coefficients of this algebraic expression? |
| 2 | Can you point out any similarity or difference between the algebraic expressions obtained in Examples 1 and 3? |
Note that the algebraic expressions in Example 1 and Example 2 involve two variables, whereas the algebraic expression in Example 3 involves only one variable.
Expressions such as 4x, x2 + 1, 2y – 5, 5y3 + y2 + 2y – 1, 3z + 7 are algebraic expressions that involve only one variable: x, y or z. In this chapter, we will restrict our discussion to algebraic expressions involving only one variable. You may have noticed that in an algebraic expression, the powers of a variable also appear. For example, in the expression x2+ 5x + 1, the highest power of x is 2, whereas in the expression 5y3 + y2 – 8, the highest power of the variable y is 3. Further, in the expression 5y3 + y2 + 2y – 1, the coefficient of y3 is 5, that of y2 is 1, that of y is 2 and the constant term is –1.
Such algebraic expressions involving one variable and its powers are called one-variable polynomials, univariate polynomials, or when the context is clear, simply polynomials. (‘univariate’ means ‘having one variable’). The highest power of the variable in a polynomial is called its degree. For example:
- 5y3+ y2+ 2y – 1 is a polynomial of degree 3. Such polynomials are called cubic polynomials.
- x2 + 5x + 1 is a polynomial of degree 2. Such polynomials are called quadratic polynomials.
- 3z + 7 is a polynomial of degree 1. Such polynomials are called linear polynomials.
- The constant 8 is a polynomial of degree 0 as it can be written as 8x0 in which the power of the variable x is 0. Such polynomials are called constant polynomials.
- Find the degrees of the following polynomials:
- Write polynomials of degrees 1, 2 and 3.
- What are the coefficients of x2 and x3in the polynomial x4 – 3x3+ 6x2– 2x + 7?
- What is the coefficient of z in the polynomial 4z3 + 5z2 – 11?
- What is the constant term of the polynomial 9x3 + 5x2– 8x –10? Recall that polynomials of degree 1 are called linear polynomials. In this chapter, we shall study linear polynomials.
(i) 2x2 – 5x + 3
(ii) y3 + 2y – 1
(iii) – 9
(iv) 4z – 3
2.2 Linear Polynomials
We begin with some examples involving linear polynomials.
Example 4: The perimeter of a square of side x is 4x, which is a linear polynomial in the variable x.
| Think and Reflect | |
|---|---|
| 1 | Find the perimeter of squares with sides 1 cm, 1.5 cm, 2 cm, 2.5 cm and 3 cm. What will happen to the perimeters if the sides increase by 0.5 cm? |
Example 5: A chess club charges a joining fee of ₹200 plus ₹50 for every match played. The following table shows the amount a player will have to pay as the number of matches varies.
| Number of matches played | 1 | 2 | 3 | 4 | 5 | ... | m |
| Amount paid(₹) | 250 | 300 | 350 | 400 | 450 | ... | 200 +50m |
Hence, if m is the number of matches played, the total cost will be ₹(200 + 50m). Observe that 200 + 50m is a linear polynomial in the variable m. The amount paid increases by the constant value of ₹50 for every additional match played.
| Think and Reflect |
|---|
| If a player paid ₹750, how many matches did he play? |
The examples given above highlight a characteristic feature of linear polynomials — that the difference between the successive values at integers is constant. In Example 4, the perimeters increase by 2 cm each time the side of the square increases by 0.5 cm. Similarly in Example 5, the amount paid by a player increases by ₹50 for every additional match played. Such patterns are called linear patterns.
When we equate a linear polynomial in one variable to a constant, we get a linear equation. Let us consider the following example.
Example 6: The sum of two numbers is 64. One of the numbers is 10 more than the other. What are the two numbers?
Let the smaller number be x. Then the larger number must be x + 10. Since their sum is 64, we have the linear equation x + (x + 10) = 64. This implies that 2x + 10 = 64. Note that 2x + 10 is a linear polynomial. By equating it to 64 we get a linear equation 2x = 54 or x = 27. The numbers are therefore, 27 and 37.
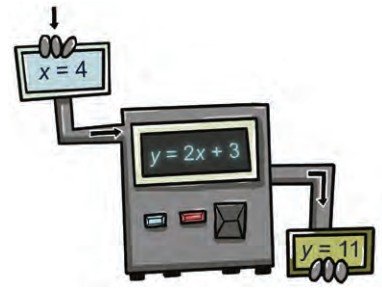
Polynomials can also be thought of as input-output processes. For instance, consider the linear polynomial 2x + 3. For every x, there is a corresponding value of the polynomial 2x + 3. For instance, if x = 4, we substitute 4 in the expression to get 2 × 4 + 3 = 11.
If x = –6, then we substitute –6 in the expression to get 2 × –6 + 3 = –9.
Fig. 2.3 shows this process as an input-output machine where the input is the value of x and the output is the value of 2x + 3. This process can be referred to as a function where the expression 2x + 3 is a function of the variable x. You will learn more about functions in later grades.
| Think and Reflect |
|---|
| We have learnt that to evaluate the value of an algebraic expression, we substitute a value of the variable in the given expression. Consider Example 3, where the wire is bent to form a rectangle. Here, the area of the rectangle, 10x – x2, is a function of x. Can you interpret this as an input-output process? What value does the expression take when x = 6 cm? |
Note that 2x + 3 is a linear function, whereas 10x – x2 is a quadratic function.
- Find the value of the linear polynomial 5x – 3 if:
- Find the value of the quadratic polynomial 7s2 – 4s + 6 if:
- The present age of Salil’s mother is three times Salil’s present age. After 5 years, their ages will add up to 70 years. Find their present ages.
- The difference between two positive integers is 63. The ratio of the two integers is 2:5. Find the two integers.
- Ruby has 3 times as many two-rupee coins as she has five rupee-coins. If she has a total `88, how many coins does she have of each type?
- A farmer cuts a 300 feet fence into two pieces of different sizes. The longer piece is four times as long as the shorter piece. How long are the two pieces?
- If the length of a rectangle is three more than twice its width and its perimeter is 24 cm, what are the dimensions of the rectangle?
(i) x = 0
(ii) x = –1
(iii) x = 2
(i) s = 0
(ii) s = –3
(iii) s = 4
2.3 Exploring linear patterns
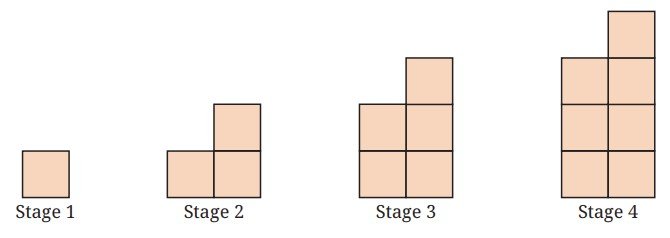
Observe the following growing pattern of square tiles.
| Think and Reflect |
|---|
| Predict the number of squares in the next three stages of the pattern and write the sequence of numbers up to Stage 7 of the pattern. |
Each stage is obtained by adding two more tiles to the previous stage. The table mentions the number of tiles for the first seven stages.
| Stage | 1 | 2 | 3 | 4 | 5 | 6 | 7 |
| Number of the square tiles | 1 | 3 | 5 | 7 | 9 | 11 | 13 |
To generalise this pattern, we observe that the number of squares at each stage is one less than twice the number of the term. For example, in Term 2, the number of squares is 2 × 2 – 1 = 3, in Term 5, the number of squares is 2 × 5 – 1 = 9 and so on
This leads us to conclude that the number of squares at Stage n is given by 2n – 1.
The polynomial 2n – 1 has degree 1. Hence, it is an example of a linear polynomial. Also, the difference between consecutive terms in the sequence of the number of squares, that is, 1, 3, 5, 7, 9 … is the constant value 2. Thus, with each stage, the number of squares increases by 2. The relationship between the number of the stage and the number of square tiles is a linear relationship.
| Think and Reflect |
|---|
| Using the expression 2n – 1, can you find out how many tiles will be there in the 15th stage and the 26th stage of the pattern? Also, which stage will contain 21 tiles and 47 tiles? |
Example 7: Bela has ₹100 for pocket money. She spends ₹5 every day. After how many days will she be left with ₹40?
| Day Number | 0 | 1 | 2 | 3 | 4 |
| Amount left (₹) | 100 | 100 – 1 × 5 = 95 | 100 – 2 × 5 = 90 | 100 – 3 × 5 = 85 | 100 – 4 × 5 = 80 |
Observe that the amount left on the nth day will be ₹(100 – 5n). Therefore, on the 12th day the amount left will be ₹(100 – 12 × 5) = ₹40.
| Think and Reflect |
|---|
| What amount will be left on the 15th day? How many days will it take for the entire amount to be spent? |
Example 8: An auto-rikshaw fare starts at ₹25 and remains the same for the initial 2 km. Then it increases by ₹15 per km. What will be the fare for a travel of 10 km?
For the initial 2 km, the fare is ₹25. For every kilometre (km) thereafter, the fare will increase by ₹15. Therefore, the total fare for a travel of 10 km will be ₹25 + 15 × 8 = ₹145.
| Km travelled | 1 | 2 | 3 | 4 | 5 | 6 |
| Fare (₹) | 25 | 25 | 25 + 1 × 15 = 40 | 25 + 2 × 15 = 55 | 25 + 3 × 15 = 70 | 25 + 4 × 15 = 85 |
Observe that the total fare for a travel of n km will be ₹25 + 15 × (n – 2) = 15n – 5, when n ≥ 2. Here, the fare for a specific distance covered is a function of the distance n km.
| Think and Reflect |
|---|
| For how many km will the fare be ₹130? |
Note that in all the above examples, the nth term is a linear expression in n. A linear pattern is a sequence of numbers where the difference between two consecutive terms is constant. We will learn more about linear patterns in the chapter on Sequences and Progressions.
Solve the following:
- A student has ₹500 in her savings bank account. She gets ₹150 every month as pocket money. How much money will she have at the end of every month from the second month onwards? Find a linear expression to represent the amount she will have in the nthmonth.
- A rally starts with 120 members. Each hour, 9 members drop out of the group. How many members will remain after 1, 2, 3, … hours? Find a linear expression to represent the number of members at the end of the nth hour.
- Suppose the length of a rectangle is 13 cm. Find the area if the breadth is (i) 12 cm, (ii) 10 cm, (iii) 8 cm. Find the linear pattern representing the area of the rectangle.
- Suppose the length of a rectangular box is 7 cm and breadth is 11 cm. Find the volume if the height is (i) 5 cm, (ii) 9 cm, (iii) 13 cm. Find the linear pattern representing the volume of the rectangular box.
- Sarita is reading a book of 500 pages. She reads 20 pages every day. How many pages will be left after 15 days? Express this as a linear pattern.
2.4. Linear growth and linear decay
Linear expressions help to model situations or phenomena where there is growth or decline. Consider the following examples:
Example 9: The cost of a journey is given by the linear function C(d) = 100 + 60d, where C indicates total cost in rupees and d the distance travelled in km. Let us make a table of values for d varying from 0 to 10 km and show how the cost increases for every km.
| Distance travelled, d (km) | 0 | 1 | 2 | 3 | 4 | 5 |
| Cost, C(₹) | 100 | 160 | 220 | 280 | 340 | 400 |
In this example, as the value of d increases by one km, the value of the cost function C, increases by a fixed amount of `60. This is an example of linear growth.
| Think and Reflect |
|---|
| What is the cost for travelling 15 km? For how many kilometres will the cost of the journey be ₹700? |
Example 10: The height of water in a cylindrical tank is 3 m at the start of summer. The height h m at the end of t months is given by the linear function h(t) = 3 – 0.5t.
| Month, t | 0 | 1 | 2 | 3 | 4 |
| Height, h (m) | 3 | 2.5 | 2 | 1.5 | 1 |
In the example above, as the value of t increases by a fixed number (one month), the value of the height h decreases by a fixed number (0.5). Therefore, this example represents linear decay.
| Think and Reflect |
|---|
| What will be the height of the water at the end of 5 months? |
Linear growth describes a linear pattern where a quantity increases by a constant amount over equal intervals. Similarly, linear decay describes a linear pattern where a quantity decreases by a constant amount over equal intervals
- Suppose a plant has height 1.75 feet and it grows by 0.5 feet each month.
- A mobile phone is bought for ₹10,000. Its value decreases by ₹800 every year.
- The initial population of a village is 750. Every year, 50 people move from a nearby city to the village.
- A telecom company charges ₹600 for a certain recharge scheme. This prepaid balance is reduced by ₹15 each day after the recharge.
(i) Find the height after 7 months.
(ii) Make a table of values for t varying from 0 to 10 months and show how the height, h, increases every month.
(iii) Find an expression that relates h and t, and explain why it represents linear growth.
(i) Find the value of the phone after 3 years.
(ii) Make a table of values for t varying from 0 to 8 years and show how the value of the phone, v, depreciates with time.
(iii) Find an expression that relates v and t, and explain why it represents linear decay.
(i) Find the population of the village after 6 years.
(ii) Make a table of values for t varying from 0 to 10 years and show how the population, P, increases every year.
(iii) Find an expression that relates P and t, and explain why it represents linear growth.
(i) Write an equation that models the remaining balance b(x) after using the scheme for x days. Explain why it represents linear decay
(ii) After how many days will the balance run out?
(iii) Make a table of values for x varying from 1 to 10 days and show how the balance b(x), reduces with time.
2.5 Linear Relationships
A linear relationship represents the relationship between two variables x and y, and can be expressed as y = ax + b.
Let us revisit the growing pattern of square tiles in Fig. 2.4. If x represents the number of the term and y represents the numbers of square tiles, then the linear relationship between x and y is expressed as y = 2x – 1.
Sometimes, we may be required to find the linear relationship between two quantities.
Example 11: A telecom company charges a fixed monthly fee and an additional cost per GB of the internet data used. A student observes that when she used 10 GB, her bill was ₹350. When she used 20 GB, her bill was ₹550. If the monthly bill y depends on the amount of data used, x (in GB), according to the relation y = ax + b, find the values of a and b.
Note that x = number of GB of the internet data used and y = total monthly cost in Rupees.
To find the linear relationship y = ax + b, we note that when x = 10, y = 350. Also, when x = 20, y = 550. We substitute these in y = ax + b to arrive at the following equations.
350 = 10a + b and 550 = 20a + b
We solve these as follows: Let b = 350 – 10a (from the first equation). We substitute this in the second equation to obtain
550 = 20a + (350 – 10a)
Thus, 550 = 10a + 350 or 10a = 200. So, a = 20. This leads to b = 350 – 10a = 350 – 200 = 150.
We substitute the values of a and b in the equation y = ax + b to obtain y = 20x + 150.
Thus, y = 20x + 150 represents the linear relationship between y, the bill amount in Rupees, and x, the number of GB of the internet data used.
| Think and Reflect |
|---|
| Can you guess what the numbers 20 and 150 in the equation y = 20x + 150 represent? |
- A learning platform charges a fixed monthly fee and an additional cost per digital learning module accessed. A student observes that when she accessed 10 modules, her bill was ₹400. When she accessed 14 modules, her bill was ₹500. If the monthly bill y depends on the number of modules accessed, x, according to the relation y = ax + b, find the values of a and b.
- A gym charges a fixed monthly fee and an additional cost per hour for using the badminton court. A student using the gym observed that when she used the badminton court for 10 hours, her bill was ₹800. When she used it for 15 hours, her bill was ₹1100. If the monthly bill y depends on the hours of the use of the badminton court, x, according to the relation y = ax + b, find the values of a and b.
- Consider the relationship between temperature measured in degrees Celsius (°C) and degrees Fahrenheit (°F), which is given by °C = a °F + b. Find a and b, given that ice melts at 0 degrees Celsius and 32 degrees Fahrenheit, and water boils at 100 degrees Celsius and 212 degrees Fahrenheit.
(Hint: When °C = 0, °F = 32 and when °C = 100, °F = 212. Use this information to find a and b, and thus, the linear relationship between °C and °F.)
2.6 Visualising linear relationships
As we have seen in many examples in this chapter, a linear pattern or relationship can be expressed in the form of an equation y = ax + b. Now we shall learn to plot such an equation as a straight line.
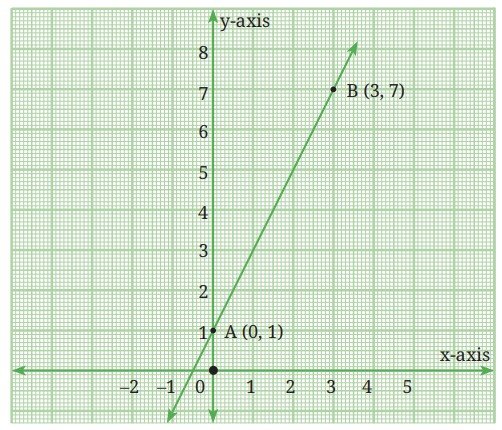
To plot a linear equation, we need to identify any two points on the line. For example, to plot y = 2x + 1, we may identify two points as follows:
When x = 0, y = 1, so (0, 1) is a point on the line. We can call this point A. We say that the x-coordinate of A is 0 and the y-coordinate is 1. Also, when x = 3, y = 7. Thus, B (3, 7) is another point on the line. We plot these points on the coordinate plane, join them and extend the line in both directions as shown in Fig. 2.5.
| Think and Reflect | |||||||
|---|---|---|---|---|---|---|---|
| Identify other points on the line by completing the following table. | |||||||
| x | 1 | 2 | 5 | 7 | 9 | 12 | 20 |
| y | 3 | 15 |
Note that (1, 3) and (7, 15) are also the points on the line y = 2x + 1. Plot the points on the line. You may use a graph paper for this task. Observe that if a point lies on a line, its coordinates must satisfy the equation of the line. Thus, we can verify that (7, 15) lies on the line y = 2x + 1 by substituting x = 7 and y = 15 in the equation.
Example 12: Let us plot the points (–1, –3), (0, 0), (1, 3), (3, 9), (4, 12) in the coordinate plane on a graph paper as shown in Fig. 2.6. Join the points (–1, –3) and (4, 12) using a ruler. Doing so, observe that all five points lie on a straight line. Can you guess the equation of this line by looking at the relationship between the x and y coordinates of each point?
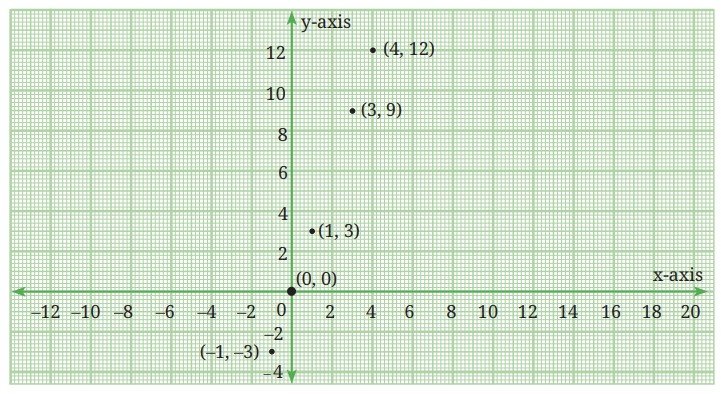
For each point, the value of the y-coordinate is three times that of the x-coordinate. We can therefore say that y = 3x.
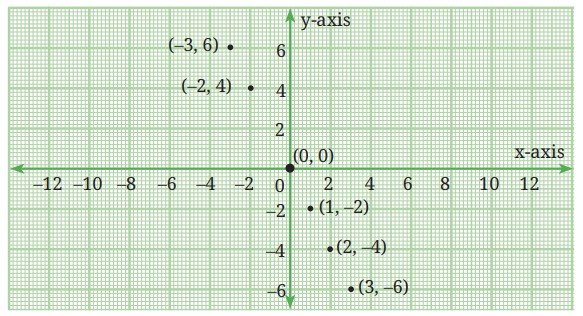
Example 13: Let us plot the points (– 3, 6), (– 2, 4), (0, 0), (1, – 2), (2, – 4), (3, – 6) in the coordinate plane on a graph paper as shown in Fig. 2.7. Join the points (– 3, 6) and (3, – 6) using a ruler. Doing so, observe that all five points lie on a straight line. Can you guess the equation of this line by looking at the relationship between the x and y coordinates of each point?
Example 14: Draw the graphs of y = 1/2 x, y = x, y = 2x by selecting suitable points on these lines.
(Hint: In order to graph y = 1/2 x, we could take the points (0, 0) and (4, 2). Can you verify that these lie on the line?)
Fig. 2.8 shows the graphs of these linear equations without any points labelled.
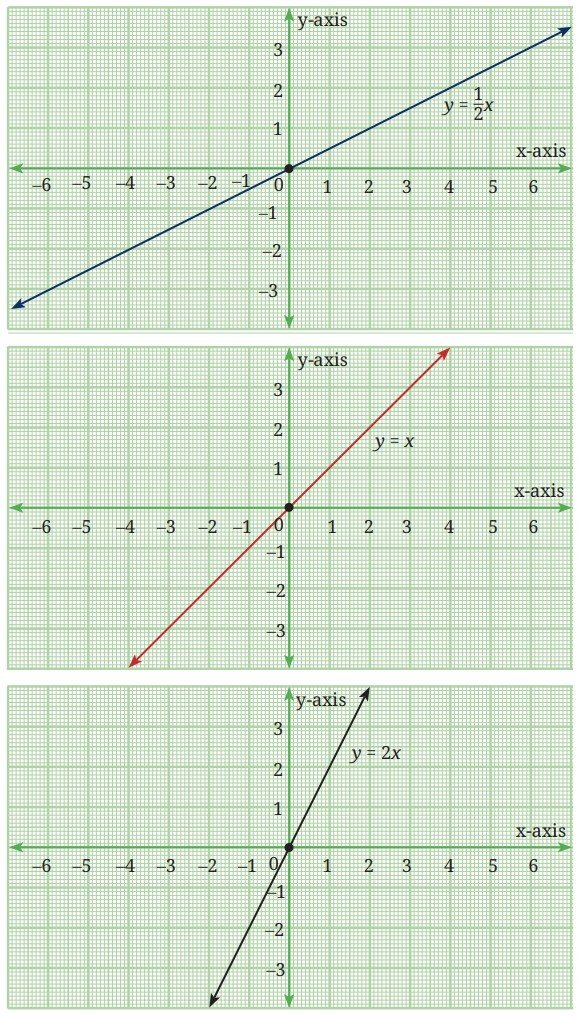
Fig. 2.9 shows all the three graphs on the same axes. Does this help you to conclude anything about the linear equation y = ax, a > 0 as a varies? What happens when a > 1 and when a < 1 ?
(Hint: You may also plot the equations y = 3x and y = 1/3 x on the same axes.)
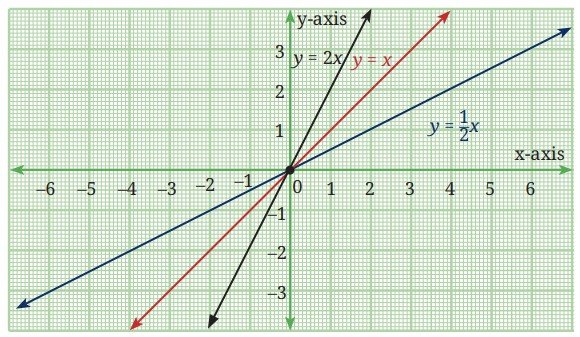
First of all, we observe that the straight lines representing an equation of the form y = ax, always pass through the origin (0, 0). Further, when a > 1, the line is steeper than the line y = x, which is equally inclined to both axes. However, when a < 1, the line is less steep than the line y = x. In fact, a is referred to as the slope of the line y = ax. We will learn more about the concept of the slope of a line in the chapter on linear equations.
For now, we focus on another important observation. A linear growth is represented by a straight line with positive slope while a linear decay is represented by a straight line with negative slope. Note that the number of square tiles in the pattern in Fig. 2.4 leads to the sequence 1, 3, 5, 7, …. in which the difference of consecutive terms is the constant 2. The slope of the line representing the linear relationship between the term number and the number of square tiles is y = 2x – 1 is 2. Hence, the slope represents the constant difference between consecutive terms of the sequence.
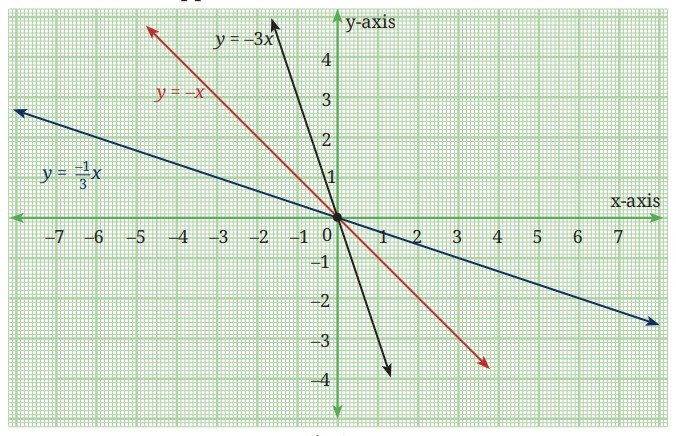
Example 15: Now let us draw the graphs of y = –1/3 x, y = – x, y = – 3x by selecting suitable points on these lines. Fig. 2.10 shows the graphs of these linear equations without any points labelled on them.
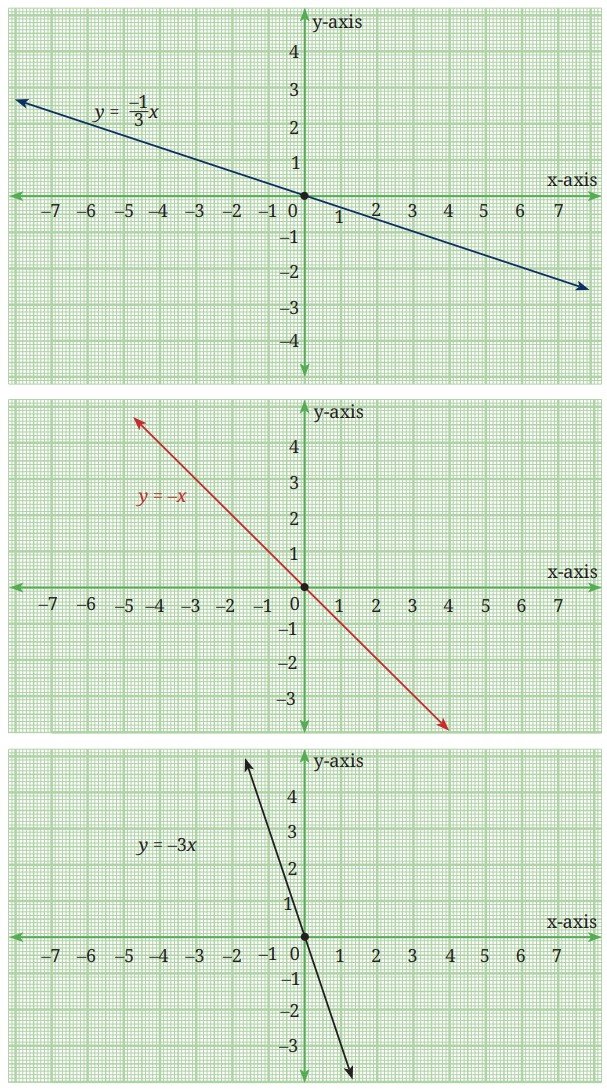
Fig. 2.11 shows all the three graphs on the same axes. Does this help you to conclude anything about the linear equation y = – ax, a > 0, as a varies? What will happen when a > 1 and when a < 1?
| Think and Reflect |
|---|
| Differentiate between the graphs of the equations y = 3x + 1, and y = –3x + 1. |
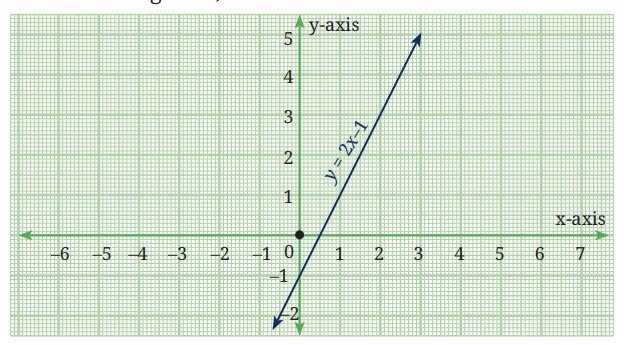
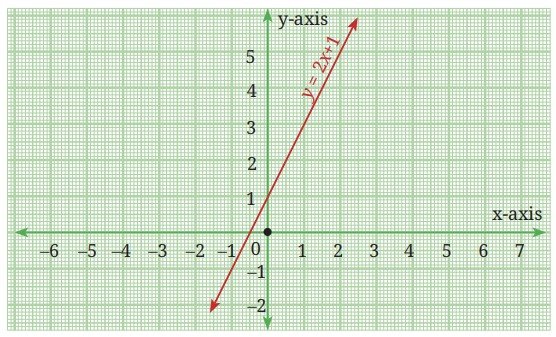
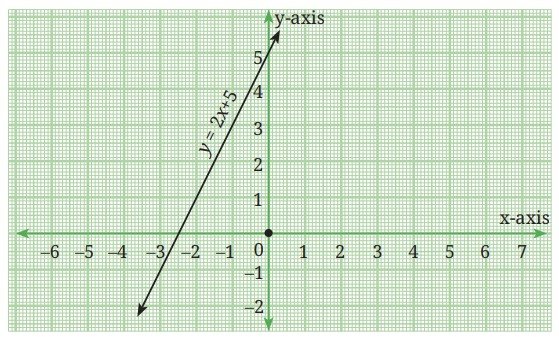
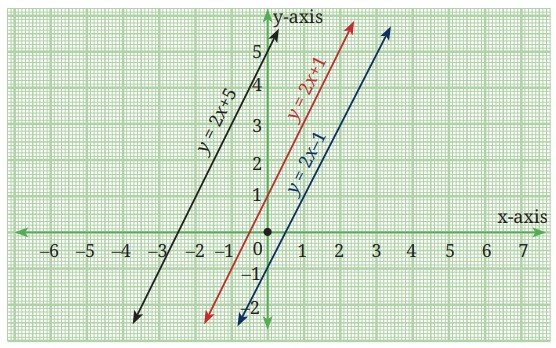
Example 16: Let us now draw the graphs of y = 2x – 1, y = 2x + 1, y = 2x + 5, first individually (as shown in Fig. 2.12) and then on the same axes (as shown in Fig. 2.13).
| Think and Reflect |
|---|
| Does this help you to conclude anything about the linear equation y = ax + b when a is fixed but b varies? |
(Hint: In these equations a = 2, and b takes the values –1, 1 and 5, respectively.)
Now let us draw the graphs of the equations y = x + 3, y = 2x + 5 and y = 3x – 2. See Fig. 2.14 and observe where these lines cut the y-axis.
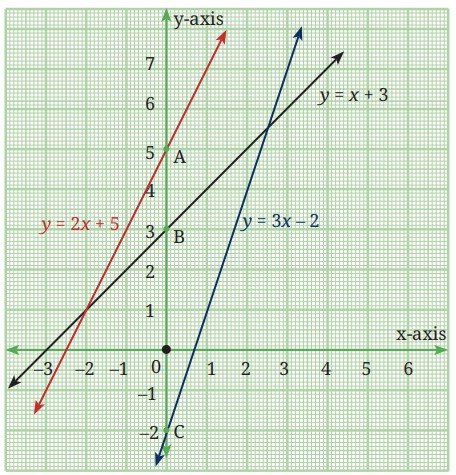
We see that,
y = 2x + 5 cuts the y-axis at A (0, 5),
y = x + 3 cuts the y-axis at B (0, 3), and
y = 3x – 2 cuts the y-axis at C (0, –2).
We observe that any straight line written in the form y = ax + b cuts the y-axis at the point (0, b). The length b is referred to as the y-intercept of the line. Thus, the y-intercept of the line y = x + 3 is 3. This means that the line cuts the y-axis at a distance of 3 units from the origin in the positive direction. Similarly, the y-intercept of the line y = 3x – 2 is – 2.
This means that the line cuts the y-axis at a distance of 2 units from the origin in the negative direction.
gin in the negative direction. After observing the graphs in Figures 2.8 to 2.14, we may conclude the following:
(i) In the equation y = ax + b, a represents the slope of the line and b represents the y-intercept.
(ii) If we change the values of a, keeping b fixed, the slope of the line changes while the y-intercept remains fixed.
(iii) If we change the values of b keeping the value of a fixed, the lines shift but remain parallel to the original line. Thus, lines with equal slopes but different y-intercepts are parallel to each other
- Draw the graphs of the following sets of lines. In each case, reflect on the role of ‘a’ and ‘b’.
(i) y = 4x, y = 2x, y = x
(ii) y = – 6x, y = – 3x, y = – x
(iii) y = 5x, y = –5x
(iv) y = 3x – 1, y = 3x, y = 3x + 1
(v) y = –2x – 3, y = –2x, y = 2x + 3
- Write a polynomial of degree 3 in the variable x, in which the coefficient of the x2 term is –7.
- Find the values of the following polynomials at the indicated values of the variables.
- If we multiply a number by 5/2 and add 2/3 to the product, we get –7/12. Find the number
- A positive number is 5 times another number. If 21 is added to both the numbers, then one of the new numbers becomes twice the other new number. What are the numbers?
- If you have `800 and you save `250 every month, find the amount you have after (i) 6 months (ii) 2 years. Express this as a linear pattern.
- The digits of a two-digit number differ by 3. If the digits are interchanged, and the resulting number is added to the original number, we get 143. Find both the numbers
- Draw the graph of the following equations, and identify their slopes and y-intercepts. Also, find the coordinates of the points where these lines cut the y-axis.
- If the temperature of a liquid can be measured in Kelvin units as x K and in Fahrenheit units as y °F, the relation between the two systems of measurement of temperature is given by the linear equation y = 9/5 (x – 273) + 32.
- The work done by a body on the application of a constant force is the product of the constant force and the distance travelled by the body in the direction of the force. Express this in the form of a linear equation in two variables (work w and distance d), and draw its graph by taking the constant force as 3 units. What is the work done when the distance travelled is 2 units? Verify it by plotting it on the graph.
- The graph of a linear polynomial p(x) passes through the points (1, 5) and (3, 11).
- Let p(x) = ax + b and q(x) = cx + d be two linear polynomials such that:
- Look at the first three stages of a growing pattern of hexagons made using matchsticks. A new hexagon gets added at every stage which shares a side with the last hexagon of the previous stage.
- Let p(x) = ax + b and q(x) = cx + d be two linear polynomials such that:
- Find the polynomials p(x) and q(x). Also, find the coordinates of the point where these lines meet the x-axis.
- What do all linear functions of the form f(x) = ax + a, a > 0, have in common?
(i) 5x2– 3x + 7 if x = 1
(ii) 4t3– t2+ 6 if t = a
(i) y = –3x + 4
(ii) 2y = 4x + 7
(iii) 5y = 6x – 10
(iv) 3y = 6x – 11
Are any of the lines parallel?
(i) Find the temperature of the liquid in Fahrenheit if the temperature of the liquid is 313 K.
(ii) If the temperature is 158 °F, then find the temperature in Kelvin.
(i) Find the polynomial p(x).
(ii) Find the coordinates where the graph of p(x) cuts the axes.
(iii) Draw the graph of p(x) and verify your answers.
(i) p(0) = 5.
(ii) The polynomial p(x) – q(x) cuts the x-axis at (3, 0).
(iii) The sum p(x) + q(x) is equal to 6x + 4 for all real x.
Find the polynomials p(x) and q(x).
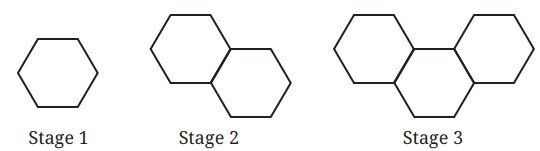
(i) Draw the next two stages of the pattern. How many matchsticks will be required at these stages?
(ii) Complete the following table.
| x | 1 | 2 | 5 | 7 | 9 | 12 | 20 |
| y | 3 | 15 |
(iii) Find a rule to determine the number of matchsticks required for the nth stage.
(iv) How many matchsticks will be required for the 15th stage of the pattern?
(v) Can 200 matchsticks form a stage in this pattern? Justify your answer
(i) The graph of p(x) passes through the points (2, 3) and (6, 11).
(ii) The graph of q(x) passes through the point (4, –1).
(iii) The graph of q(x) is parallel to the graph of p(x).
Chapter summary
- An algebraic expression combines numbers, variables, and operation symbols. For example, 2x2+ 5xy – 3y2 is an algebraic expression in the variables x and y. 2x2, 5xy and – 3y2 are the terms of the algebraic expression, and the numbers 2, 5 and – 3 are coefficients of the terms.
- Univariate Polynomials are algebraic expressions in one variable. Thus x2+ 5x + 3 and 3y3 – 4y2 + 5 are univariate polynomials in x and y, respectively. The highest power of the variable in a univariate polynomial is called its degree. Thus, x2+ 5x + 3 is of degree 2 while 3y3 – 4y2 + 5 is of degree 3.
- A polynomial of degree one is called a linear polynomial. Hence, 2x + 3 and 5 – 4y are linear polynomials in the variables x and y, respectively
- Linear growth refers to a pattern in which a quantity increases by a fixed amount over equal intervals. In contrast, linear decay describes a pattern in which a quantity decreases by a fixed amount over equal intervals.
- A linear pattern is a sequence of numbers where the difference between consecutive terms is constant.
- A linear relationship between two variables x and y is represented by a straight line y = ax + b. The slope of this line is a. The constant b is called the y-intercept which is the distance from the origin where the line cuts the y-axis. When b = 0, the equation of the line becomes y = ax and the line passes through the origin.
- Linear growth is represented by a straight line with positive slope and linear decay is represented by a straight line with negative slope.
- Parallel lines are of the form y = ax + b, where the slope a is fixed while b, the y-intercept, varies.