Table of Contents

The Mathematics of Maybe: Introduction to Probability

7.1 What is Probability?
Probability is a type of measurement, similar to how we measure quantities like length, area, or volume. However, instead of measuring physical quantities, probability is used to measure the likelihood of events. Specifically, it helps us express how confident or certain we are that a particular event will occur. For example, you may ask your friend:
• Is it going to rain today?
• Will our school win the inter-school hockey match tomorrow?
• Will I be chosen in the monthly lucky draw to perform at the school assembly? [The names of all the students in school are written on slips of paper and one slip is randomly selected.]

These events are examples of random events. We know the possible outcomes (either it will rain today or it will not; our school team will either win, draw or lose the hockey match; one student will be chosen to perform at the school assembly), but we do not know in advance which one will definitely occur. That is, there is an element of chance or randomness involved every time such an event takes place.
Can we predict these outcomes with 100% certainty? One could respond to these questions with words such as impossible or certain, or using phrases such as less likely, more likely or equally likely. This decision is based on different kinds of evidence that have been gathered. For example, one friend might say, “The sun is shining brightly, so it’s unlikely to rain today”, while another might observe, “It’s very hot, which makes me think it could rain later”. In both cases, they are predicting rainfall based on how they interpret the present weather conditions. This is the subjective probability given to the event of today’s rainfall.
As you can see from the above example, probability deals with uncertainty or chance. One key feature of our increasingly complicated society is that we must deal with questions that have no fixed answer but rather one or more possibilities for the answer. Thus, understanding how to objectively estimate the probability of events is crucial in many aspects of life.
In this chapter, we will learn how we can measure probability more objectively, i.e., the ways of collecting evidence that can be used for an objective estimate of likelihood. But first, we must understand a few terms and ideas such as randomness and the probability scale.
7.1.1 What is Randomness?
Randomness refers to a situation or action (like the tossing of a coin or the rolling of a die) where you cannot predict exactly what will happen. Although you may know all the possible outcomes, you cannot say which one will definitely occur. For example,
• Tossing a coin: You know it could be heads or tails, but you cannot be sure which one will come up in a single toss.
• Rolling a die: You know the possible outcomes are 1, 2, 3, 4, 5, or 6, but you do not know which number will appear on a particular roll.
These observations (commonly called experiments or trials in probability) are called random because of their unpredictability. The lucky draw example mentioned earlier is an example of a random observation or experiment, as the outcome cannot be predicted in advance, and each student has an equal chance of being selected. All you can say is what could happen, not what will happen.
Random Observations: A random experiment is something you can repeat (like tossing a coin), where every time you do it, the result might be different and you cannot know the outcome in advance.
Such unpredictability can be useful sometimes! For example, in a cricket match, the fact that a coin is tossed to decide which team will bat first is considered to be a fair method. Can you explain why?
Probability is the area of mathematics that studies randomness and how likely a specific outcome is to happen in a random situation. For example, when you toss a coin, the probability for heads is 1/2, and for tails is 1/2, because each is equally likely. In a random experiment, every outcome has a chance to occur, but you can only determine the likelihood, not the exact result.
Have you wondered what makes an event like rain random? An event like rain is considered random because it depends on many complex factors in the atmosphere (such as temperature, humidity, wind patterns, and pressure) and is so sensitive to these factors that it is impossible to predict it with total certainty. Thus, it is impossible to know with absolute certainty whether it will rain on a specific day. Randomness in rain means that while the exact timing and location of rainfall cannot be predicted perfectly, we can estimate the likelihood or probability of rain in different locations based on patterns and probabilities derived from data.
Ask your friend to predict the outcome of a `1 coin you toss. Do you see that your friend could guess heads or tails but could not know for certain? That’s randomness! All possible results are known, but each individual try is unpredictable.
7.1.2 The Probability Scale
Probability is measured on a scale from 0 to 1 to indicate the likelihood of the occurrence of an event. If the probability of your school winning the hockey match is 0.75, that means there is a 75% chance your school will win. This means that it is more likely than not that your school will win the match. If the probability of your school winning the hockey match is 0.5, that means there is a 50% chance your school will win. This means that it is equally likely that your school will win or lose the match. On the other hand, if the probability is 0, it would mean winning is impossible (for example, winning without playing), and if the probability is 1, it would mean your school is certain to win. The probabilities of most events fall somewhere strictly between 0 and 1, expressing how likely they are to happen.
Imagine a deck of six cards where the number of purple and green cards is unknown. The probability of picking a purple card from the deck (see Fig. 7.1) can range from impossible (if there are no purple cards) to certain (if all six are purple). As the number of purple cards increases, the likelihood of selecting a purple card moves smoothly along the probability scale from less likely, to even chance, to more likely. This scale helps us understand and compare how likely different events are, just like using a number line!
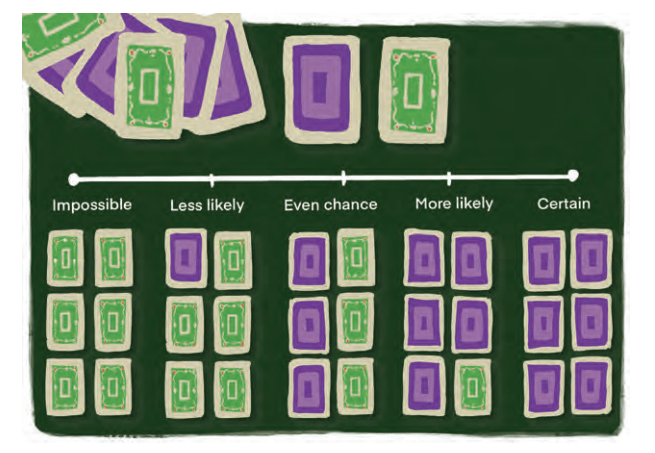 Fig. 7.1: Probabilities of picking a purple card from a deck on the probability scale
 Here are a few examples of events and the probabilities of their occurrence. Look at the examples against the probability scale in Fig. 7.1 to understand how probability is measured on a scale.
| Event | What it means |
|---|---|
| Getting a number greater than 6 on a die | Impossible: Dice only have numbers from 1 to 6. |
| Rolling a 3 on a standard die | Less likely: But not impossible as one face of the die is 3. |
| Flipping a coin and getting heads | Even chance: Heads or tails are equally likely |
| Drawing any number from 2 to 10 from a deck of 52 cards | More likely: There are 36 cards in a deck of 52 cards with numbers from 2 to 10. |
| Choosing a red sweet from a bag of all red sweets | Certain: All the sweets are red. |
1. Rank the following events on a scale from 0 (Impossible) to 1 (Certain). Label each event: Impossible, less likely, equally likely (even chance), more likely, certain. Give reasons why you gave each event its ranking. (i) The next Monday will come after Sunday.
(ii) It will snow in Mumbai in July.
(iii) An elephant will walk through your classroom today.
(iv) You will greet at least one friend at school tomorrow.
7.2 Measuring Probability Objectively
1. Using evidence from experience: This involves collecting data either by performing an experiment multiple times or by analysing statistical data from past observations. In both cases, the probability is estimated by calculating the relative frequency of the event based on the collected evidence. We call this experimental probability.
2. Using theoretical methods: This approach assumes that all possible outcomes are equally likely (when there is no reason to believe that any one outcome is more likely than another). The probability is then determined by reasoning about the number of favourable outcomes in relation to the total number of possible outcomes. We call this theoretical probability.
7.2.1 Experimental Probability: Performing Observations or Experiments
Another way of obtaining objective estimates for probabilities is to perform an experiment. In an experiment, the event is a result of the experiment and is called an outcome. The set of all possible outcomes in an experiment is called the sample space.
The sample space may be listed within brackets, separated by commas as shown below. Example 1: Experiment: A coin is tossed
Possible Outcomes: Heads (H) or Tails (T) (See Fig. 7.2) Sample Space: {H, T}
Experiment: A die is rolled
Possible Outcomes: The top side of the die shows 1, 2, 3, 4, 5, or 6 dots (See Fig. 7.3)
Sample Space: {1, 2, 3, 4, 5, 6}

Fig. 7.2: Heads and tails of a coin
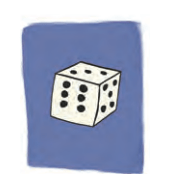
Fig. 7.3: A 6-sided die
Experimental Probability = Number of times the event occurred /Total Number of trials
Example 2: Suppose you roll a die 50 times, and it lands on a 4 exactly 8 times.
Experimental probability of rolling a 4 is 8/50 = 0 1. % 6 1 or 6.
We also say that the relative frequency of rolling a 4 is 8/50 = 0 1. 6.
Relative frequency helps you understand probability based on actual data, rather than theoretical predictions. It is especially useful in statistics and data analysis when you are working with observed outcomes.
Did you know? The game of Snakes | 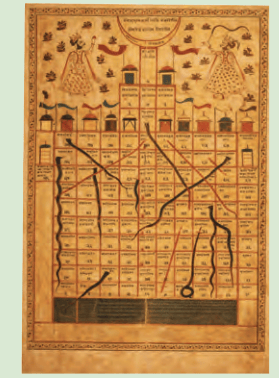 Fig. 7.4: A Jain Jñān-Chaupad̤ game on cloth, National Museum (India, 19th century) |
7.2.2 Theoretical Probability
Theoretical probability studies the likelihood of an event happening based on all possible outcomes being equally likely. It is what we expect to happen in an ideal, perfectly fair situation. In this scenario, no experiment or data is required. Theoretical probability is usually denoted as P (Event) or P (Outcome).
Theoretical Probability (P) = Number of favourable outcomes /Number of possible outcomes
Example 3: If you roll a standard 6-sided die, what is the theoretical probability of getting a 4?
Solution:
Number of favourable outcomes = 1 (only the number 4)
Number of all possible outcomes = 6 (the numbers 1 through 6)
P (rolling a 4) = 1/6 = 0.1666… ≈ 0.167 or 16.7%.
Example 4: A letter is picked at random from the word ‘PROBABILITY’. What is the probability of picking the letter B?
Solution:
Number of favourable outcomes = 2 (there are 2 Bs in the word PROBABILITY)
Number of all possible outcomes = 11 (The number of letters in the word PROBABILITY)
P (Picking the letter B) =2 /11 = 0.1818... ≈ 0.182 or 18.2%
7.2.3 Analysing Statistical Data Using Probability
The way of collecting evidence through statistical data is used extensively in the world of business for marketing, forecasting sales, insurances and in science and social science research.
Example 5: Suppose you anonymously collect information regarding the favourite fruit of 50 students in your class. Let us assume that the results are: 20 students like mango, 15 students like apples, 10 students like bananas, and 5 students like grapes. Let us play a game! Suppose we randomly pick one student from the class and try to guess their favourite fruit. What’s the probability that the student’s favourite fruit is mango? Statistical probability is based on collected data. So, a reasonable estimate that the student’s favourite fruit is mango is
Probability of mango as the favourite fruit = Number of students who like mango/Total number of students = 20/ 50 = 0.4
So, there is a 0.4 or 40% chance that a randomly chosen student in the class likes mango.
Now assume that you want to buy fruits for the entire school depending on the students’ favourite fruits. You would need to estimate the quantity of each type of fruit you need to purchase for the entire school of, say, 1500 students. It is usually impractical to collect data from all students or the entire population. The application of statistical probability in the real world is usually based on evidence collected from a sample. The population, i.e., the total number of students in the school, is 1500, and we collected evidence from a sample of 50 students from one class. An estimate of the probability that mango is the favourite fruit was calculated to be 0.4. So, that would mean that we need to buy approximately 600 (40% of 1500) mangoes, while the remaining would be other fruits — apples, bananas and grapes. If we want to be more confident about our estimate, we would choose a larger sample, for example, by asking 100 students, and make sure it is more representative, such as including students from different classes or grades. This process is called sampling in statistics.
| LEARN MORE ABOUT SAMPLING |
|---|
| Want to learn more about sampling? What we have learned so far is just the beginning! When collecting data through samples, there are other important things to think about — like how big your sample should be and how to make sure your sample truly represents the whole population. The size of your sample and making sure it’s fair and not biased can help your results be more accurate. If you are interested and want to explore more about why sample size and representation matter in statistics, you can read more about it in print or digital resources. |
Summarising, experimental probability is based on actual data collected from trials, not on assumptions. Theoretical probability relies on the assumption of equally likely outcomes (a perfectly fair situation) and does not use experimental data. Even in perfectly fair situations, experimental probability can differ from theoretical probability, especially when the number of trials is small. As the number of trials increases, the experimental probability tends to get closer to the theoretical probability — this is known as the Law of Large Numbers.
If I have rolled a 4 on a die 8 times in succession, the probability of rolling a 4 again is still only ≈ 0.16 (assuming the die is fair). Probability does not tell you what will happen next but predicts what will happen in the long run.
| GAMBLER’S FALLACY |
|---|
| Many people think that if something random happens many times in a row (like flipping a coin and getting heads six times), then the opposite outcome (tails) is more likely to happen next. But actually, the coin does not keep track of what happened before. Every time you flip, the chance of heads or tails stays exactly the same — like starting afresh. The coin has no memory, so past flips do not change what happens next. This common misunderstanding is called Gambler’s Fallacy. For example, imagine that you are flipping a fair coin. It comes up heads six times in a row. You might feel that on the next flip you are sure to get a tail, because tails haven’t come up for a while. However, the probability of getting tails on the next flip is still 50% or 1/2, exactly the same as before. The coin has no memory of past flips! |
Example 6: Let us say you are playing Snakes and Ladders, and you are rolling a fair 6-sided die to move. You have just rolled the die three times in a row, and each time you got a 6.
Now, you think: ‘I have already rolled three 6s — there is no way I will get a 6 again on the next roll!’
This thinking is Gambler’s Fallacy — because each roll of the die is an independent event. The probability of rolling a 6 is always: 1 6 ≈ 0.166 or 16.6%.
It does not change based on what happened in previous turns.
Key Idea: In Snakes and Ladders, as in many games of chance, each roll of dice is independent. The Gambler’s Fallacy tricks people into believing there is a pattern, when in fact, such randomness has no memory
| FAIR AND UNBIASED |
|---|
| When we speak of a coin, we assume it to be ‘fair’, i.e., it is symmetrical so that there is no reason for it to come down more often on one side than the other. We call this property of the coin as being ‘unbiased’. By the phrase ‘random toss’, we mean that the coin is allowed to fall freely without any bias or interference. |
1. A teacher mixes a large bag of sweets of different colours and randomly selects a sample of 30 sweets. She counts the number of sweets of each colour: 10 red sweets | 8 green sweets | 7 yellow sweets | 5 blue sweets
(i) Calculate the probability that a randomly picked sweet from the sample is green.
(ii) If there are 600 sweets in total in the large bag, estimate how many are likely to be yellow, based on the sample results.
2. A survey is conducted at a school where a random sample of 40 students is asked about their favourite club. The responses are: 14 students: Science Club | 11 students: Arts Club | 9 students: Sports Club | 6 students: Debate Club Assume there are 800 students in the whole school.
(i) What is the probability that a randomly chosen student from the sample prefers the Arts Club?
(ii) Using the sample results, estimate how many students in the whole school are likely to prefer the Sports Club.
3. Toss a coin 20 times and record the result each time (heads or tails).
(i) How many times did you get heads?
(ii) How many times did you get tails?
(iii) Calculate the experimental probability of getting heads.
(iv) If you toss the coin once more, what is the probability of getting tails?
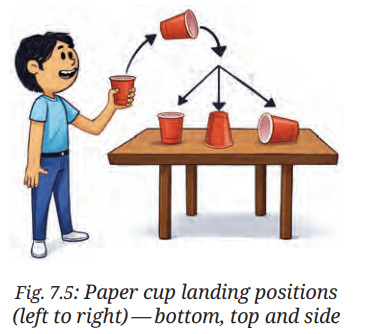
4. Toss a paper cup into the air 100 times. After each toss record whether the cup lands on its bottom, upside down on its top or on its side (See Fig. 7.5). Assign probabilities to the outcomes by using experimental probability.
5. What is the probability of getting an even number when rolling a fair 6-sided die?
6. Suppose you roll a 6-sided die 12 times and get a ‘3’ three times.
(i) What is the experimental probability of rolling a ‘3’?
(ii) What is the theoretical probability of rolling a ‘3’?
(iii) Why might these probabilities be different? What would you expect to happen if you roll the die 60, 600, or 6000 times?
7.3 Elements of Probability: Sample Spaces and Events
7.3.1 Sample Space
Recall that the sample space, denoted by S, is the list of all possible outcomes. Each possible outcome is called an element of the sample space.• The sample space S must include every possible outcome.
• No outcome should be listed more than once.
• The number of elements in the sample space is called the sample size and is denoted by n(S).
Examples of Sample Space 1. The sample space for whether it rains tomorrow could be S = {Rain, No Rain} and the sample size n(S) = 2.
2. The sample space for a match, i.e., the possible outcomes for a team playing — could be S = {Win, Lose, Draw} and sample size n(S) = 3.
3. Tossing a Coin:
• Experiment: Tossing a fair coin once.
• Sample Space: S = {Heads (H), Tails (T)}
• Sample Size = 2
4. Rolling a Die:
• Experiment: Rolling a standard 6-sided die.
• Sample Space: S = {1, 2, 3, 4, 5, 6}
• Sample Size = 6
5. Tossing Two Coins:
• Experiment: Tossing two coins
simultaneously.
• Sample Space: S = {HH, HT, TH, TT}
• Sample Size = 4
| Coin 1 | Coin 2 | Outcome |
| H | H | HH |
| H | T | HT |
| T | H | TH |
| T | T | TT |
When we used the sample space {Rain, No Rain} in Example 1, we focused only on whether it will rain or not. However, if we want to include different amounts of rainfall like drizzle, light rain or heavy rain, we need to expand the sample space to {No Rain, Drizzle, Light Rain, Heavy Rain} so that it better matches the level of detail required for the question. It is important to ensure the sample space is detailed enough to suit the specific problem being studied.
7.3.2 Events
An event is any single possible result or combination of results that might happen when you perform a random action. It is like choosing particular outcomes from all the things that could possibly occur. An event is a subset of a sample space.
Examples of Sample Spaces and Events
1. Tossing Two Coins
• Sample space: All possible results like Head–Head, Head–Tail, Tail–Head, Tail–Tail. S = Sample Space = {HH, HT, TH, TT}
• Event: ‘At least one coin shows Head.’ E = {HH, HT, TH}.
2. Rolling a 6-sided Die
• Sample space: All faces numbered 1 through 6. S = {1, 2, 3, 4, 5, 6}
• Event: ‘The number rolled is greater than 4.’ E = {5, 6}.
3. Picking Fruit from a Basket
• Sample space: Types of fruit you might pick, for example,
Apple, Banana and Orange. S = {Apple, Banana, Orange}
• Event: ‘Picking a fruit that is yellow.’ E = {Banana}.
1. When a single 6-sided die is rolled, what is the total number of possible outcomes in the sample space?
2. For the following experiments write down the sample space S.
(i) Rolling a die and tossing a coin together.
(ii) Choosing a random integer between – 5 and + 5.
(iii) A box containing 5 green and 7 red balls. One ball is drawn at random.
3. In a village fair, there are 3 popular snacks available: Samosa, Pakora, and Bhaji. For drinks, villagers can choose either Chai or Lassi.
(i) List the sample space of all possible snack and drink combinations a person could choose at the fair.
(ii) List the event ‘Selecting Samosa as a snack.’
A tree diagram is a visual representation used to list all possible outcomes of a multi-step experiment. A multi-step experiment involves a series of independent trials. For example, tossing a coin two times, or rolling a dice three times are examples of multi-step experiments. Each branch of the tree represents a possible outcome, and branches split to show different paths for subsequent events.
A tree diagram is useful for
• Visualising multi-step experiments, where each path from start to end represents one complete outcome.
• Listing all outcomes of a sample space.
So far in this chapter, we have seen examples of single-step experiments. Let us look at an example of a multi-step experiment.
Example 7: Experiment: Toss a fair coin two times.
Tree Diagram (See Fig. 7.6):
From a single point draw a line to each of the possible outcomes of the first toss. From each of these outcomes draw two lines to each possible outcome. Do you see that the tree diagram shows 4 possible outcomes?
Hence the Sample Space S = {HH, HT, TH, TT}.
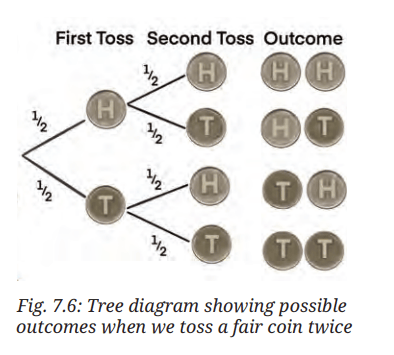
Also, the theoretical probabilities of each outcome are mentioned on the branch representing that outcome.
Theoretical Probability (P) = Number of favourable outcomes / Number of possible outcomes. Let us consider the event of getting Heads twice. This is representedby the outcome HH. Probability of HH = 1/4 = 0.25 or 25%.
Can you calculate the probability of getting one head and one tail?
1. There are two fruit baskets A and B. Basket A has one apple and two oranges. Basket B has one banana and one mango. You randomly pick one fruit from each basket.
(i) Draw a tree diagram showing all possible pairs of fruits.
(ii) List the sample space.
(iii) What is the probability of picking one apple and one banana?
2. Let us say that you have a box containing 3 red pens, 4 black pens and 2 green pens. You pick a pen (without looking) from the box and put it back. Then your friend does the same.
(i) What are the possible outcomes of the pen colours? Can you draw a tree diagram representing the possible outcomes?
(ii) Can you use the tree diagram to guess the probability that both you and your friend pick pens of the same colour?
1. Fill in the blanks.
(i) The probability of an impossible event is _______.
(ii) The set of all possible outcomes of a random experiment is called the __________.
(iii) The probability of an event that is certain to happen is _______.
(iv) Tossing a fair coin has a probability of ______ for getting heads.
2. In a survey of 50 students, 15 students said they liked football. The number of students who like football is 15, and the ________ (frequency/relative frequency) is __________ (fill in the fraction or decimal).
3. Which of the following experiments have equally likely outcomes? Explain.
(i) A driver attempts to start a car. The car starts or does not start.
(ii) Tossing a fair coin once.
(iii) Rolling a fair 6-sided die.
(iv) Choosing a marble randomly from a bag that contains 3 red marbles and 7 blue marbles.
(v) A baby is born. It is a boy or a girl.
4. Write the sample space and calculate the probability based on the given information.
(i) Two coins are tossed at the same time. What is the probability of getting at least one head?
(ii) Ten identical cards numbered 1 to 10 are placed in a box. One card is drawn at random. What is the probability of drawing a card with an even number?
(iii) A die is rolled once. What is the probability of getting a number greater than 4?
(iv) A bag contains 3 red balls, 2 blue balls, and 1 green ball. One ball is picked at random. What is the probability that it is not red?
(v) Three coins are tossed simultaneously. What is the probability of getting exactly two heads?
5. A bag has 3 candies: strawberry, lemon, and mint. One is picked at random. What is the probability of picking a strawberry candy?
6. A child has 2 shirts (one red and one blue) and 3 types of pants (jeans, khakis, and shorts). List all the possible combinations of outfits consisting of one shirt and one pair of pants. Display your answer in a table format.
7. A tyre company records distances before replacement in 1000 cases.
| Distance (km) | Less than 4000 | 4001 to 9000 | 9001 to 14000 | More than 14000 |
| Number of cases | 20 | 210 | 325 | 445 |
Find the probability that a randomly chosen tyre lasts: (i) Less than 4000 km.
(ii) Between 4000 and 14000 km.
(iii) More than 14000 km.
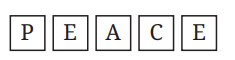
8. The letters of the word ‘PEACE’ are placed on cards. Leela draws a card without looking. (i) What is the probability that it is a P, E or C?
(ii) What is the probability that it is not an E?
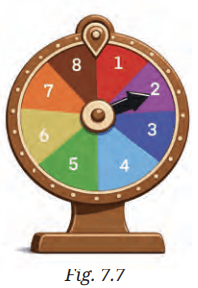
*9. A game of chance consists of spinning an arrow (see Fig. 7.7.) which comes to rest pointing at one of the numbers 1, 2, 3, 4, 5, 6, 7, 8, and these are equally likely outcomes. What is the probability that it will point at
(i) 8?
(ii) An odd number?
(iii) A number greater than 2?
(iv) A number less than 9?
(v) A multiple of 3?
*10. A basket contains 4 red balls and 5 blue balls. One ball is drawn and laid aside, and a second ball is drawn. Draw a tree diagram to represent the possible outcomes and probabilities. Use the tree diagram to answer the following questions.
(i) What is the probability of drawing a red ball and then a blue ball?
(ii) What is the probability of drawing 2 blue balls?
*11. I throw a pair of 6-sided dice. Write down an event that has a probability of 0 and an outcome that has a probability of 1.
*12. Write the sample space and calculate the probability based on the given information.
(i) Two dice are rolled. What is the probability that the sum is a prime number greater than 5?
(ii) A bag contains 4 red, 3 green, and 2 blue balls. Two balls are drawn without replacement. What is the probability that both are of different colours?
(iii) Three coins are tossed. What is the probability that the first coin shows heads and exactly two heads occur in total?
(iv) A four-digit number is formed using the digits 1, 2, 3, and 4 with no repetition. What is the probability that the number is even?
(v) A student takes a multiple-choice test with 3 questions, each having 4 options (A, B, C, D), with only one correct answer. What is the probability that the student guesses and gets exactly 2 answers correct?
*13. A box contains 4 balls numbered 1 to 4. Record a sample space using a tree diagram for the following experiments:
(i) A ball is drawn, and the number is recorded. Then the ball is returned, and a second ball is drawn and recorded.
(ii) A ball is drawn and recorded. Without replacing the first ball, the experimenter draws and records a second ball.
(iii) What are the sizes of these two sample spaces?
*14. List the elements of a sample space for the simultaneous tossing of a coin and drawing of a card from a set of 6 cards numbered 1 through 6.
*15. Three coins are tossed, and the number of heads is recorded. Which of the following lists is a sample space for this experiment? Why do the other lists fail to qualify as a sample space?
(i) {1, 2, 3}
(ii) {0, 1, 2}
(iii) {0, 1, 2, 3, 4}
(iv) {0, 1, 2, 3}
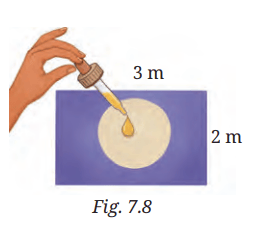
*16. Suppose you drop a dye at random on the rectangular region shown in Fig. 7.8. What is the probability that it will land inside the circle with a diameter of 1 m?
Chapter Summary
• Probability is a measurement of the likelihood of an event.
• Probability is expressed on a scale from 0 (indicating impossibility) to 1 (indicating certainty), representing the likelihood of an event occurring. The probability of an event E is denoted as P(E), where 0 ≤ P(E) ≤ 1.
• Experimental probability is determined by conducting an experiment and is calculated as:
Experimental Probability = (Number of times the event occurred) / (Total number of trials)
• Theoretical probability is based on all possible outcomes in a fair situation, assuming each is equally likely:
Theoretical Probability of an event A is P(A) = (Number of favourable outcomes) / (Number of possible outcomes)
• A sample space is the list of all possible outcomes of a random experiment. It is represented as a set S = {outcome₁, outcome₂, ..., outcomeₙ}.
• An event is any one or a group of possible outcomes from a random experiment. It is like picking results or outcomes from all that could happen.
• Tree diagrams help us to list and visualise all possible outcomes of a random experiment. They also help us calculate probabilities of events related to random experiments.