Table of Contents
��CHAPTER 2
Collection of Data


Studying this chapter should enable you to:
• understand the meaning and purpose of data collection;
• distinguish between primary and secondary sources;
• know the mode of collection of data;
• distinguish between Census and Sample Surveys;
• be familiar with the techniques of sampling;
• know about some important sources of secondary data
1. INTRODUCTION
In the previous chapter, you have read about what is economics. You also studied about the role and importance of statistics in economics. In thischapter, you will study the sources of data and the mode of data collection. The purpose of collection of data is to show evidence for reaching a sound and clear solution to a problem.
In economics, you often come across a statement like this,
"After many fluctuations the output of food grains rose to 132 million tonnes in 1978-79 from 108 million tonnes in 1970-71, but fell to 108 million tonnes in 1979-80. Production of food grains then rose continuously to 252 million tonnes in 2015-16 and touched 272 million tonnes in 2016-17."
In this statement, you can observe that the food grains production in different years does not remain the same. It varies from year to year and from crop to crop. As these values vary, they are called variable. The variables are generally represented by the letters X. Y or Z. Each value of a variable is an observation. For example, the food grain production in India varies between 108 million tonnes in 1970- 71 to 272 million tonnes in 2016-17 as shown in the following table. The years are represented by variable X and the production of food grain in India (in million tonnes) is represented by variable Y.
TABLE 2.1
Production of Food Grain in India (Million Tonnes)
| X | Y |
| 1970-71 1978–79 1990–91 1997–98 2001–02 2015-16 2016-17 | 108 132 176 194 212 252 272 |
Here, the values of these variables X and Y are the 'data', from which we can obtain information about the production of food grains in India. To know the fluctuations in food grains production, we need the 'data' on the production of food grains in India for various years. 'Data' is a tool, which helps in understanding problems by providing information.
You must be wondering where do 'data' come from and how do we collect these? In the following sections we will discuss the types of data, method and instruments of data collection and sources of obtaining data.
2. WHAT ARE THE SOURCES OF DATA?
Statistical data can be obtained from two sources. The researcher may collect the data by conducting an enquiry. Such data are called Primary Data, as they are based on first hand information. Suppose, you want to know about the popularity of a filmstar among school students. For this, you will have to enquire from a large number of school students, by asking questions from them to collect the desired information. The data you get, is an example of primary data.
If the data have been collected and processed (scrutinised and tabulated) by some other agency, they are called Secondary Data. They can be obtained either from published sources such as government reports, documents, newspapers, books written by economists or from any other source, for example, a website. Thus, the data are primary to the source that collects and processes them for the first time and secondary for all sources that later use such data. Use of secondary data saves time and cost. For example, after collecting the data on the popularity of the filmstar among students, you publish a report. If somebody uses the data collected by you for a similar study, it becomes secondary data.
3. HOW DO WE COLLECT THE DATA?
Do you know how a manufacturer decides about a product or how a political party decides about a candidate? They conduct a survey by asking questions about a particular product or candidate from a large group of people. The purpose of surveys is to describe some characteristics like price, quality, usefulness (in case of the product) and popularity, honesty, loyalty (in case of the candidate). The purpose of the survey is to collect data. Survey is a method of gathering information from individuals.
Preparation of Instrument
The most common type of instrument used in surveys is questionnaire/ interview schedule. The questionnaire is either self administered by the respondent or administered by the researcher (enumerator) or trained investigator. While preparing the questionnaire/interview schedule, you should keep in mind the following points;
- The questionnaire should not be too long. The number of questions should be as minimum as possible.
- The questionnaire should be easy to understand and avoid ambiguous or difficult words.
- The questions should be arranged in an order such that the person answering should feel comfortable.
- The series of questions should move from general to specific. The questionnaire should start from general questions and proceed to more specific ones. For example:
Poor Q
(i) Is increase in electricity charges justified?
(ii) Is the electricity supply in your locality regular?
Good Q
(i) Is the electricity supply in your locality regular?
(ii) Is increase in electricity charges justified?
- The questions should be precise and clear. For example,
Poor Q
What percentage of your income do you spend on clothing in order to look presentable?
Good Q
What percentage of your income do you spend on clothing?
- The questions should not be ambiguous. They should enable the respondents to answer quickly, correctly and clearly. For example:
Do you spend a lot of money on books in a month?
Good Q
(Tick mark the appropriate option) How much do you spend on books in a month?
(i) Less than Rs 200
(ii) Rs 200-300
(iii) Rs 300-400
(iv) More than Rs 400
- The question should not use double negatives. The questions starting with "Wouldn't you" or "Don't you" should be avoided, as they may lead to biased responses. For example:
Poor Q
Don't you think smoking should be prohibited?
Good Q
Do you think smoking should be prohibited?
- The question should not be a leading question, which gives a clue about how the respondent should answer. For example:
Poor Q
How do you like the flavour of this high- quality tea?
Good Q
How do you like the flavour of this tea?
- The question should not indicate alternatives to the answer. For example:
Poor Q
Would you like to do a job after college or be a housewife?
Good Q
What would you like to do after college?
The questionnaire may consist of closed-ended (or structured) questions or open-ended (or unstructured) questions. The above question about what a student wants do after college is an open-ended question.
Closed-ended or structured questions can either be a two-way question or a multiple choice question. When there are only two possible answers, 'yes' or 'no', it is called a two- way question.
When there is a possibility of more than two options of answers, multiple choice questions are more appropriate. Example,
Q. Why did you sell your land?
(i) To pay off the debts.
(ii) To finance children's education.
(iii) To invest in another property.
(iv) Any other (please specify).
Closed-ended questions are easy to use, score and to codify for analysis, because all respondents can choose from the given options. But they are difficult to write as the alternatives should be clearly written to represent both sides of the issue. There is also a possibility that an individual's true response is not present among the options given. For this, the choice of 'Any Other' is provided, where the respondent can write a response, which was not anticipated by the researcher. Moreover, another limitation of multiple-choice questions is that they tend to restrict the answers by providing alternatives, without which the respondents may have answered differently.
Open-ended questions allow for more individualised responses, but they are difficult to interpret and hard to score, since there are a lot of variations in the responses. Example,
Q. What is your view about globalisation?
Mode of Data Collection
Have you ever come across a television show in which reporters ask questions from children, housewives or general public regarding their examination performance or a brand of soap or a political party? The purpose of asking questions is to do a survey for collection of data. There are three basic ways of collecting data: (i) Personal Interviews, (ii) Mailing (questionnaire) Surveys, and (iii) Telephone Interviews.
Personal Interviews
This method is used when the researcher has access to all the members. The researcher (or investigator) conducts face-to-face interviews with the respondents.
Personal interviews are preferred due to various reasons. Personal contact is made between the respondent and the interviewer. The interviewer has the opportunity of explaining the study and answering the queries of respondents. The interviewer can request the respondent to expand on answers that are particularly important. Misinterpretation and misunderstanding can be avoided. Watching the reactions of respondents can provide supplementary information.
Personal interview has some demerits too. It is expensive, as it requires trained interviewers. It takes longer time to complete the survey. Presence of the researcher may inhibit respondents from saying what they really think.

Mailing Questionnaire
When the data in a survey are collected by mail, the questionnaire is sent to each individual by mail with a request to complete and return it by a given date. The advantages of this method are that, it is less expensive. It allows the researcher to have access to people in remote areas too, who might be difficult to reach in person or by telephone. It does not allow influencing of the respondents by the interviewer. It also permits the respondents to take sufficient time to give thoughtful answers to the questions.
These days online surveys or surveys through short messaging service, i.e., SMS are popular. Do you know how an online survey is conducted?
The disadvantages of mail survey are that there is less opportunity to provide assistance in clarifying instructions, so there is a possibility of misunderstanding the questions. Mailing is also likely to produce low response rates due to certain factors, such as returning the questionnaire without completing it, not returning the questionnaire at all, loss of questionnaire in the mail itself, etc.

Telephone Interviews
In a telephone interview, the investigator asks questions over the telephone. The advantages of telephone interviews are that they are cheaper than personal interviews and can be conducted in a shorter time. They allow the researcher to assist the respondent by clarifying the questions. Telephonic interview is better in cases where the respondents are reluctant to answer certain questions in personal interviews.
The disadvantage of this method is access to people, as many people may not own telephones.

Pilot Survey
Once the questionnaire is ready, it is advisable to conduct a try-out with a small group which is known as Pilot Survey or Pre-testing of the questionnaire. The pilot survey helps in providing a preliminary idea about the survey. It helps in pre-testing of the questionnaire, so as to know the shortcomings and drawbacks of the questions. Pilot survey also helps in assessing the suitability of questions, clarity of instructions, performance of enumerators and the cost and time involved in the actual survey.
Activities
• You have to collect information from a person, who lives in a remote village of India. Which mode of data collection will be appropriate and why? Discuss.
• You have to interview the parents about the quality of teaching in a school. If the principal of the school is present there, what types of problems can arise?
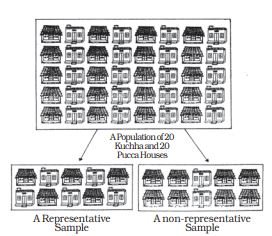
4. CENSUS AND SAMPLE SURVEYS
Census or Complete Enumeration

Population and Sample
Activities
• In which years will the next Census be held in India and China?
• If you have to study the opinion of students about the new economics textbook of class XI, what will be your population and sample?
• If a researcher wants to estimate the average yield of wheat in Punjab, what will be her/his population and sample?
Exit polls
You must have seen that when an election takes place, the television networks provide election coverage. They also try to predict the results. This is done through exit polls, wherein a random sample of voters who exit the polling booths are asked whom they voted for. From the data of the sample of voters, the prediction is made. You might have noticed that exit polls do not always predict correctly. Why?
Activities
• You have to analyse the trend of foodgrains production in India for the last fifty years. As it is difficult to collect data for all the years, you are asked to select a sample of production of ten years. Using the Random Number Tables, how will you select your sample years?
Non-Random Sampling
5. SAMPLING AND NON-SAMPLING ERRORS
Sampling Errors
Non-Sampling Errors
6. CENSUS OF INDIA AND NSSO
7. CONCLUSION
Recap
• Data is a tool which helps in reaching a sound conclusion on any problem.
• Primary data is based on first hand information.
• Survey can be done by personal interviews, mailing questionnaires and telephone interviews.
• Census covers every individual/unit belonging to the population.
• Sample is a smaller group selected from the population from which the relevant information would be sought.
• In a random sampling, every individual is given an equal chance of being selected for providing information.
• Sampling error is due to the difference between the value of the sample estimate and the value of the corresponding population parameter.
• Non-sampling errors can arise in data acquisition, by non-response or by bias in selection.
• Census of India and National Sample Survey are two important agencies at the national level, which collect, process and tabulate data on many important economic and social issues.