
Chapter 5
Accounting Ratios
Learning Objectives
After studying this chapter, you will be able to :
• Explain the meaning, objectives and limitations of analysis using accounting ratios;
• Identify the various types of ratios commonly used ;
• Calculate various ratios to assess solvency, liquidity, efficiency and profitability of the firm;
• Interpret the various ratios calculated for intra-firm and inter-firm comparisons.
Financial statements aim at providing financial information about a business enterprise to meet the information needs of the decision-makers. Financial statements prepared by a business enterprise in the corporate sector are published and are available to the decision-makers. These statements provide financial data which require analysis, comparison and interpretation for taking decision by the external as well as internal users of accounting information. This act is termed as financial statement analysis. It is regarded as an integral and important part of accounting. As indicated in the previous chapter, the most commonly used techniques of financial statements analysis are comparative statements, common size statements, trend analysis, accounting ratios and cash flow analysis. The first three have been discussed in detail in the previous chapter. This chapter covers the technique of accounting ratios for analysing the information contained in financial statements for assessing the solvency, efficiency and profitability of the enterprises.
5.1 Meaning of Accounting Ratios
As stated earlier, accounting ratios are an important tool of financial statements analysis. A ratio is a mathematical number calculated as a reference to relationship of two or more numbers and can be expressed as a fraction, proportion, percentage and a number of times. When the number is calculated by referring to two accounting numbers derived from the financial statements, it is termed as accounting ratio. For example, if the gross profit of the business is Rs. 10,000 and the ‘Revenue from Operations’ are Rs. 1,00,000, it can be said that the gross profit is 10% (10, 000 /1, 00, 000) × 100 of the ‘Revenue from Operations’. This ratio is termed as gross profit ratio. Similarly, inventory turnover ratio may be 6 which implies that inventory turns into ‘Revenue from Operations’ six times in a year.
It needs to be observed that accounting ratios exhibit relationship, if any, between accounting numbers extracted from financial statements. Ratios are essentially derived numbers and their efficacy depends a great deal upon the basic numbers from which they are calculated. Hence, if the financial statements contain some errors, the derived numbers in terms of ratio analysis would also present an erroneous scenario. Further, a ratio must be calculated using numbers which are meaningfully correlated. A ratio calculated by using two unrelated numbers would hardly serve any purpose. For example, the furniture of the business is Rs. 1,00,000 and Purchases are Rs. 3,00,000. The ratio of purchases to furniture is 3 (3,00,000/1,00,000) but it hardly has any relevance. The reason is that there is no relationship between these two aspects.
5.2 Objectives of Ratio Analysis
Ratio analysis is indispensable part of interpretation of results revealed by the financial statements. It provides users with crucial financial information and points out the areas which require investigation. Ratio analysis is a technique which involves regrouping of data by application of arithmetical relationships, though its interpretation is a complex matter. It requires a fine understanding of the way and the rules used for preparing financial statements. Once done effectively, it provides a lot of information which helps the analyst:
1. To know the areas of the business which need more attention;
2. To know about the potential areas which can be improved with the effort in the desired direction;
3. To provide a deeper analysis of the profitability, liquidity, solvency and efficiency levels in the business;
4. To provide information for making cross sectional analysis by comparing the performance with the best industry standards;
5. To provide information derived from financial statements useful for making projections and estimates for the future.
5.3 Advantages of Ratio Analysis
The ratio analysis if properly done improves the user’s understanding of the efficiency with which the business is being conducted. The numerical relationships throw light on many latent aspects of the business. If properly analysed, the ratios make us understand various problem areas as well as the bright spots of the business. The knowledge of problem areas help management take care of them in future. The knowledge of areas which are working better helps you improve the situation further. It must be emphasised that ratios are means to an end rather than the end in themselves. Their role is essentially indicative and that of a whistle blower. There are many advantages derived from ratio analysis. These are summarised as follows:
1. Helps to understand efficacy of decisions: The ratio analysis helps you to understand whether the business firm has taken the right kind of operating, investing and financing decisions. It indicates how far they have helped in improving the performance.
2. Simplify complex figures and establish relationships: Ratios help in simplifying the complex accounting figures and bring out their relationships. They help summarise the financial information effectively and assess the managerial efficiency, firm’s credit worthiness, earning capacity, etc.
3. Helpful in comparative analysis: The ratios are not be calculated for one year only. When many year figures are kept side by side, they help a great deal in exploring the trends visible in the business. The knowledge of trend helps in making projections about the business which is a very useful feature.
4. Identification of problem areas: Ratios help business in identifying the problem areas as well as the bright areas of the business. Problem areas would need more attention and bright areas will need polishing to have still better results.
5. Enables SWOT analysis: Ratios help a great deal in explaining the changes occurring in the business. The information of change helps the management a great deal in understanding the current threats and opportunities and allows business to do its own SWOT (Strength-Weakness-Opportunity-Threat) analysis.
6. Various comparisons: Ratios help comparisons with certain bench marks to assess as to whether firm’s performance is better or otherwise. For this purpose, the profitability, liquidity, solvency, etc., of a business, may be compared: (i) over a number of accounting periods with itself (Intra-firm Comparison/Time Series Analysis), (ii) with other business enterprises (Inter-firm Comparison/Cross-sectional Analysis) and (iii) with standards set for that firm/industry (comparison with standard (or industry expectations).
5.4 Limitations of Ratio Analysis
Since the ratios are derived from the financial statements, any weakness in the original financial statements will also creep in the derived analysis in the form of ratio analysis. Thus, the limitations of financial statements also form the limitations of the ratio analysis. Hence, to interpret the ratios, the user should be aware of the rules followed in the preparation of financial statements and also their nature and limitations. The limitations of ratio analysis which arise primarily from the nature of financial statements are as under:
1. Limitations of Accounting Data: Accounting data give an unwarranted impression of precision and finality. In fact, accounting data “reflect a combination of recorded facts, accounting conventions and personal judgements which affect them materially. For example, profit of the business is not a precise and final figure. It is merely an opinion of the accountant based on application of accounting policies. The soundness of the judgement necessarily depends on the competence and integrity of those who make them and on their adherence to Generally Accepted Accounting Principles and Conventions”. Thus, the financial statements may not reveal the true state of affairs of the enterprises and so the ratios will also not give the true picture.
2. Ignores Price-level Changes: The financial accounting is based on stable money measurement principle. It implicitly assumes that price level changes are either non-existent or minimal. But the truth is otherwise. We are normally living in inflationary economies where the power of money declines constantly. A change in the price-level makes analysis of financial statement of different accounting years meaningless because accounting records ignore changes in value of money.
3. Ignore Qualitative or Non-monetary Aspects: Accounting provides information about quantitative (or monetary) aspects of business. Hence, the ratios also reflect only the monetary aspects, ignoring completely the non-monetary (qualitative) factors.
4. Variations in Accounting Practices: There are differing accounting policies for valuation of inventory, calculation of depreciation, treatment of intangibles Assets definition of certain financial variables etc., available for various aspects of business transactions. These variations leave a big question mark on the cross-sectional analysis. As there are variations in accounting practices followed by different business enterprises, a valid comparison of their financial statements is not possible.
5. Forecasting: Forecasting of future trends based only on historical analysis is not feasible. Proper forecasting requires consideration of non-financial factors as well.
Now let us talk about the limitations of the ratios. The various limitations are:
1. Means and not the End: Ratios are means to an end rather than the end by itself.
2. Lack of ability to resolve problems: Their role is essentially indicative and of whistle blowing and not providing a solution to the problem.
3. Lack of standardised definitions: There is a lack of standardised definitions of various concepts used in ratio analysis. For example, there is no standard definition of liquid liabilities. Normally, it includes all current liabilities, but sometimes it refers to current liabilities less bank overdraft.
4. Lack of universally accepted standard levels: There is no universal yardstick which specifies the level of ideal ratios. There is no standard list of the levels universally acceptable, and, in India, the industry averages are also not available.
5. Ratios based on unrelated figures: A ratio calculated for unrelated figures would essentially be a meaningless exercise. For example, creditors of Rs. 1,00,000 and furniture of Rs. 1,00,000 represent a ratio of 1:1. But it has no relevance to assess efficiency or solvency.
Hence, ratios should be used with due consciousness of their limitations while evaluatory the performance of an organisation and planning the future strategies for its improvement.
Test your Understanding – I
1. State which of the following statements are True or False.
(a) The only purpose of financial reporting is to keep the managers informed about the progress of operations.
(b) Analyses of data provided in the financial statements as is termed as financial analysis
(c) Long-term creditors are concerned about the ability of a firm to discharge its obligations to pay interest and repay the principal amount
(d) A ratio is always expressed as a quotient of one number divided by another.
(e) Ratios help in comparisons of a firm’s results over a number of accounting periods as well as with other business enterprises.
(f) A ratios reflect both quantitative and qualitative aspects of results.
5.5 Types of Ratios
There is a two way classification of ratios: (1) traditional classification, and (2) functional classification. The traditional classification has been on the basis of financial statements to which the determinants of ratios belong. On this basis the ratios are classified as follows:
1. ‘Statement of Profit and Loss Ratios: A ratio of two variables from the statement of profit and loss is known as statement of profit and loss ratio. For example, ratio of gross profit to revenue from operations is known as gross profit ratio. It is calculated using both figures from the statement of profit and loss.
2. Balance Sheet Ratios: In case both variables are from balance sheet, it is classified as Balance Sheet Ratios. For example, ratio of current assets to current liabilities known as current ratio is calculated using both figures from balance sheet.
3. Composite Ratios: If a ratio is computed with one variable from the statement of profit and loss and another variable from the balance sheet, it is called composite ratio. For example, ratio of credit revenue from operations to trade receivables (known as trade receivables turnover ratio) is calculated using one figure from the statement of profit and loss (credit revenue from operations) and another figure (trade receivables) from the balance sheet.
Although accounting ratios are calculated by taking data from financial statements but classification of ratios on the basis of financial statements is rarely used in practice. It must be recalled that basic purpose of accounting is to throw light on the financial performance (profitability) and financial position (its capacity to raise money and invest them wisely) as well as changes occurring in financial position (possible explanation of changes in the activity level). As such, the alternative classification (functional classification) based on the purpose for which a ratio is computed, is the most commonly used classification which is as follows:
1. Liquidity Ratios: To meet its commitments, business needs liquid funds. The ability of the business to pay the amount due to stakeholders as and when it is due is known as liquidity, and the ratios calculated to measure it are known as ‘Liquidity Ratios’. These are essentially short-term in nature.
2. Solvency Ratios: Solvency of business is determined by its ability to meet its contractual obligations towards stakeholders, particularly towards external stakeholders, and the ratios calculated to measure solvency position are known as ‘Solvency Ratios’. They are essentially long-term in nature.
3. Activity (or Turnover) Ratios: This refers to the ratios that are calculated for measuring the efficiency of operation of business based on effective utilisation of resources. Hence, these are also known as ‘Efficiency Ratios’.
4. Profitability Ratios: It refers to the analysis of profits in relation to sales or funds (or assets) employed in the business and the ratios calculated to meet this objective are known as ‘Profitability Ratios’.
5.6 Liquidity Ratios
Liquidity ratios are calculated to have indications about the short term solvency of the business, i.e. the firm’s ability to meet its current obligations. These are analysed by looking at the amounts of current assets and current liabilities in the balance sheet. The two ratios included in this category are Current Ratio and Liquid Ratio.
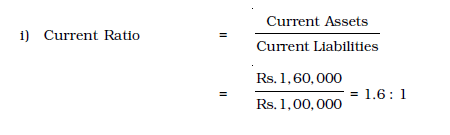
5.6.1 Current Ratio
Current ratio is the proportion of current assets to current liabilities. It is expressed as follows:
Current Ratio = Current Assets : Current Liabilities or ![]()
Current assets include current investments, inventories, trade receivables (debtors and bills receivables), cash and cash equivalents, short-term loans and advances and other current assets such as prepaid expenses, advance tax and accrued income, etc.
Current liabilities include short-term borrowings, trade payables (creditors and bills payables), other current liabilities and short-term provisions.
Illustration 1
Calculate Current ratio from the following information:
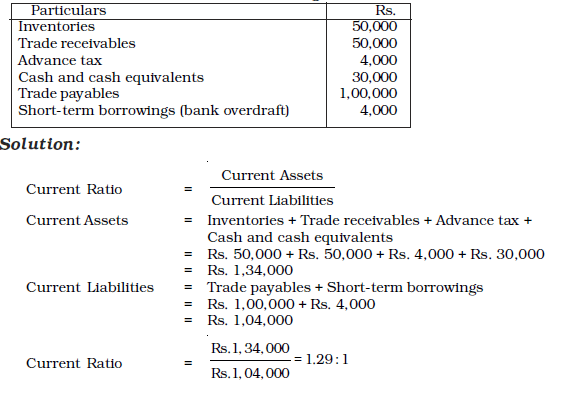
Significance: It provides a measure of degree to which current assets cover current liabilities. The excess of current assets over current liabilities provides a measure of safety margin available against uncertainty in realisation of current assets and flow of funds. The ratio should be reasonable. It should neither be very high or very low. Both the situations have their inherent disadvantages. A very high current ratio implies heavy investment in current assets which is not a good sign as it reflects under utilisation or improper utilisation of resources. A low ratio endangers the business and puts it at risk of facing a situation where it will not be able to pay its short-term debt on time. If this problem persists, it may affect firm’s credit worthiness adversely. Normally, it is safe to have this ratio within the range of 2:1.
5.6.2 Quick or Liquid Ratio
It is the ratio of quick (or liquid) asset to current liabilities. It is expressed as
Quick ratio = Quick Assets : Current Liabilities or ![]()
The quick assets are defined as those assets which are quickly convertible into cash. While calculating quick assets we exclude the inventories at the end and other current assets such as prepaid expenses, advance tax, etc., from the current assets. Because of exclusion of non-liquid current assets it is considered better than current ratio as a measure of liquidity position of the business. It is calculated to serve as a supplementary check on liquidity position of the business and is therefore, also known as ‘Acid-Test Ratio’.
Illustration 2
Calculate quick ratio from the information given in illustration 1.
Solution
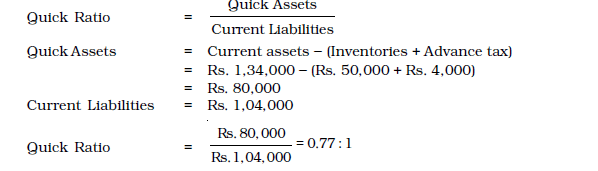
Significance: The ratio provides a measure of the capacity of the business to meet its short-term obligations without any flaw. Normally it is advocated to be safe to have a ratio of 1:1 as unnecessarily low ratio will be very risky and a high ratio suggests unnecessarily deployment of resources in otherwise less profitable short-term investments.
Illustration 3
Calculate ‘Liquidity Ratio’ from the following information:
Current liabilities = Rs. 50,000
Current assets = Rs. 80,000
Inventories = Rs. 20,000
Advance tax = Rs. 5,000
Prepaid expenses = Rs. 5,000
Solution
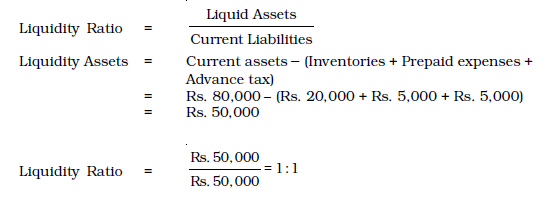
Illustration 4
X Ltd. has a current ratio of 3.5:1 and quick ratio of 2:1. If excess of current assets over quick assets represented by stock is Rs. 24,000, calculate current assets and current liabilities.
Solution
Current Ratio = 3.5:1
Quick Ratio = 2:1
Let Current Liabilities = x
Current Assets = 3.5x
And Quick Assets = 2x
Stock = Current Assets – Quick Assets
24,000 = 3.5x – 2x
24,000 = 1.5x
x = Rs.16,000
Current Assets = 3.5x = 3.5 × Rs. 16,000 = Rs. 56,000.
Verification : Current Ratio = Current Assets : Current Liabilities
= Rs. 56,000 : Rs. 16,000 = 3.5 : 1
Quick Ratio = Quick Assets – Current Liabilities = Rs. 32,000 : Rs. 16,000 = 2:1
Illustration 5
Calculate the current ratio from the following information :
Total assets = Rs. 3,00,000
Non-current liabilities = Rs. 80,000
Shareholders’ Funds = Rs. 2,00,000
Non-Current Assets:
Fixed assets = Rs. 1,60,000
Non-current Investments = Rs. 1,00,000
Solution
Total assets = Non-current assets + Current assets
Rs. 3,00,000 = Rs. 2,60,000 + Current assets
Current assets = Rs. 3,00,000 – Rs. 2,60,000 = Rs. 40,000
Total assets = Equity and Liabilities
= Shareholders’ Funds + Non-current liabilities + Current liabilities
Rs. 3,00,000 = Rs. 2,00,000 + Rs. 80,000 + Current Liabilities
Current liabilities = Rs. 3,00,000 – Rs. 2,80,000
= Rs. 20,000
Current Ratio =Current Assets/ Current Liabilities
=Rs. 40,000/Rs. 20,000 = 2:1Do it Yourself
1. Current liabilities of a company are Rs. 5,60,000, current ratio is 2.5:1 and quick ratio is 2:1. Find the value of the Inventories.
2. Current ratio = 4.5:1, quick ratio = 3:1.Inventory is Rs. 36,000. Calculate the current assets and current liabilities.
3. Current assets of a company are Rs. 5,00,000. Current ratio is 2.5:1 and Liquid ratio is 1:1. Calculate the value of current liabilities, liquid assets and inventories.
Illustration 6
The current ratio is 2:1. State giving reasons which of the following transactions would improve, reduce and not change the current ratio:
(a) Repayment of current liability;
(b) Purchased goods on credit;
(c) Sale of a Computer (Book value: Rs. 4,000) for Rs. 3,000 only;
(d) Sale of merchandise (goods) costing Rs. 10,000 for Rs. 11,000;
(e) Payment of dividend.
Solution
The given current ratio is 2 : 1. Let us assume that current assets are Rs.50,000 and current liabilities are Rs. 25,000; Thus, the current ratio is 2 : 1. Now we will analyse the effect of given transactions on current ratio.
(a) Assume that Rs. 10,000 of creditors is paid by cheque. This will reduce the current assets to Rs. 40,000 and current liabilities to Rs. 15,000. The new ratio will be 2.67 : 1(Rs. 40,000/Rs.15,000). Hence, it has improved.
(b) Assume that Rs. 10,000 goods are purchased on credit. This will increase the current assets to Rs. 60,000 and current liabilities to Rs. 35,000. The new ratio will be 1.7:1(Rs. 60,000/Rs. 35,000). Hence, it has reduced.
(c) Due to sale of a computer (a fixed asset) the current assets will increase to Rs. 53,000 without any change in the current liabilities. The new ratio will be 2.12 : 1 (Rs. 53,000/Rs. 25,000). Hence, it has improved.
(d) This transaction will decrease the inventories by Rs. 10,000 and increase the cash by Rs. 11,000 thereby increasing the current assets by Rs. 1,000 without any change in the current liabilities. The new ratio will be 2.04 : 1 (Rs. 51,000/Rs. 25,000). Hence, it has improved.
(e) Assume that Rs 5,000 is given by way of dividend. It will reduce the current assets to ₹45,000 and short-term provisions (current liabilities) by Rs 5,000. The new ratio will be 2:25:1 (Rs 45,000/Rs 20,000). Hence, it has improved.
5.7 Solvency Ratios
The persons who have advanced money to the business on long-term basis are interested in safety of their periodic payment of interest as well as the repayment of principal amount at the end of the loan period. Solvency ratios are calculated to determine the ability of the business to service its debt in the long run. The following ratios are normally computed for evaluating solvency of the business.
1. Debt equity ratio;
2. Debt ratio;
3. Proprietary ratio;
4. Total Assets to Debt Ratio;
5. Interest Coverage Ratio.
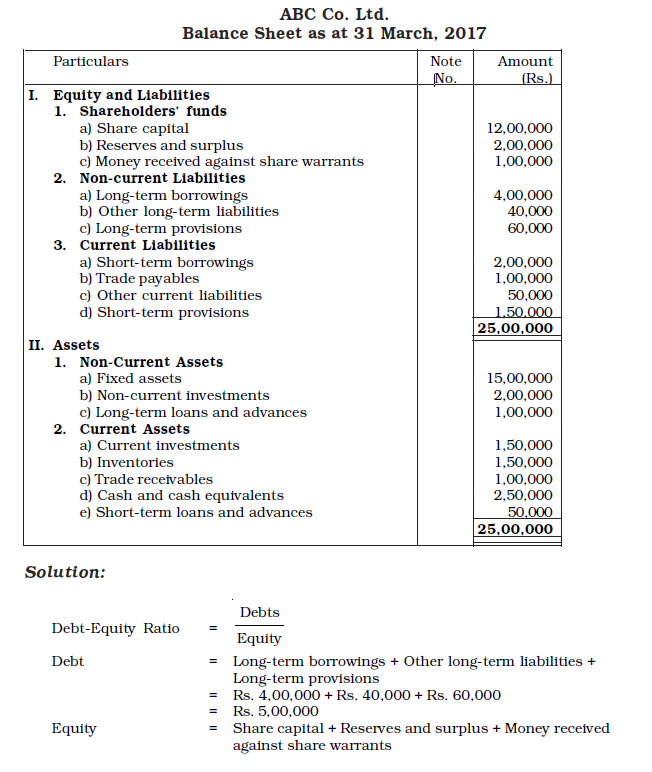
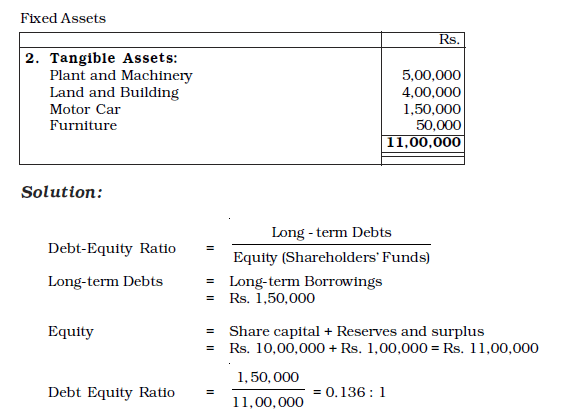
5.7.1 Debt-Equity Ratio
Debt-Equity Ratio measures the relationship between long-term debt and equity. If debt component of the total long-term funds employed is small, outsiders feel more secure. From security point of view, capital structure with less debt and more equity is considered favourable as it reduces the chances of bankruptcy. Normally, it is considered to be safe if debt equity ratio is 2 : 1. However, it may vary from industry to industry. It is computed as follows:
Debt-Equity ratio = Long-term Debts/Shareholders' Funds
where:
Shareholders’ Funds (Equity) = Share capital + Reserves and Surplus + Money received against share warrants + Share application money pending allotment
Share Capital = Equity share capital + Preference share capital
or
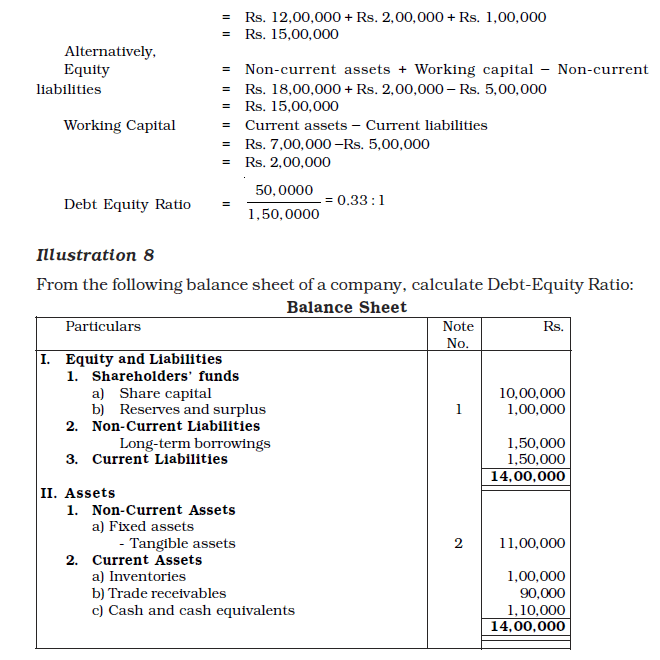
Shareholders’ Funds (Equity) = Non-current sssets + Working capital – Non-current liabilities
Working Capital = Current Assets – Current Liabilities
Significance: This ratio measures the degree of indebtedness of an enterprise and gives an idea to the long-term lender regarding extent of security of the debt. As indicated earlier, a low debt equity ratio reflects more security. A high ratio, on the other hand, is considered risky as it may put the firm into difficulty in meeting its obligations to outsiders. However, from the perspective of the owners, greater use of debt (trading on equity) may help in ensuring higher returns for them if the rate of earnings on capital employed is higher than the rate of interest payable.
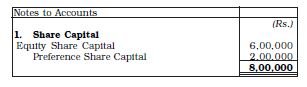
Illustration 7
From the following balance sheet of ABC Co. Ltd. as on March 31, 2015. Calculate debt equity ratio:
5.7.2 Debt to Capital Employed Ratio
The Debt to capital employed ratio refers to the ratio of long-term debt to the total of external and internal funds (capital employed or net assets). It is computed as follows:
Debt to Capital Employed Ratio = Long-term Debt/Capital Employed (or Net Assets)
Capital employed is equal to the long-term debt + shareholders’ funds. Alternatively, it may be taken as net assets which are equal to the total assets – current liabilities taking the data of Illustration 7, capital employed shall work out to Rs. 5,00,000 + Rs. 15,00,000 = Rs. 20,00,000. Similarly, Net Assets as Rs. 25,00,000 – Rs. 5,00,000 = Rs. 20,00,000 and the Debt to capital employed ratio as Rs. 5,00,000/Rs. 20,00,000 = 0.25:1.
Significance : Like debt-equity ratio, it shows proportion of long-term debts in capital employed. Low ratio provides security to lenders and high ratio helps management in trading on equity. In the above case, the debt to Capital Employed ratio is less than half which indicates reasonable funding by debt and adequate security of debt.
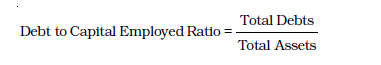
It may be noted that Debt to Capital Employed Ratio can also be computed in relation to total assets. In that case, it usually refers to the ratio of total debts (long-term debts + current liabilities) to total assets, i.e., total of noncurrent and current assets (or shareholders’, funds + long-term debts + current liabilities), and is expressed as
5.7.3 Proprietary Ratio
Proprietary ratio expresses relationship of proprietor’s (shareholders) funds to net assets and is calculated as follows :
Proprietary Ratio = Shareholders' Funds/Capital employed (or net assets)
Based on data of Illustration 7, it shall be worked out as follows:
Rs. 15,00,000/Rs. 20,00,000 = 0.75 : 1
Significance: Higher proportion of shareholders funds in financing the assets is a positive feature as it provides security to creditors. This ratio can also be computed in relation to total assets instead of net assets (capital employed). It may be noted that the total of debt to capital employed ratio and proprietory ratio is equal to 1. Take these ratios worked out on the basis of data of Illustration 7, the debt to Capital Employed ratio is 0.25 : 1 and the Proprietory Ratio 0.75 : 1 the total is 0.25 + 0.75 = 1. In terms of percentage it can be stated that the 25% of the capital employed is funded by debts and 75% by owners’ funds.
5.7.4 Total Assets to Debt Ratio
This ratio measures the extent of the coverage of long-term debts by assets. It is calculated as
Total assets to Debt Ratio = Total assets/Long-term debts
Taking the data of Illustration 8, this ratio will be worked out as follows:
Rs. 14,00,000/Rs. 1,50,000 = 9.33 : 1
The higher ratio indicates that assets have been mainly financed by owners funds and the long-term loans is adequately covered by assets.
It is better to take the net assets (capital employed) instead of total assets for computing this ratio also. It is observed that in that case, the ratio is the reciprocal of the debt to capital employed ratio.
Significance: This ratio primarily indicates the rate of external funds in financing the assets and the extent of coverage of their debts are covered by assets.
Illustration 9
From the following information, calculate Debt Equity Ratio, Total Assets to Debt Ratio, Proprietory Ratio, and Debt to Capital Employed Ratio:
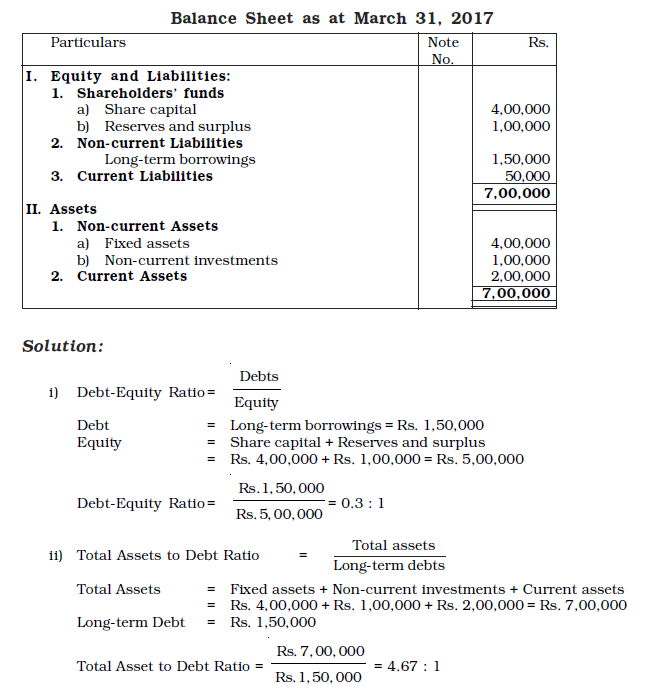
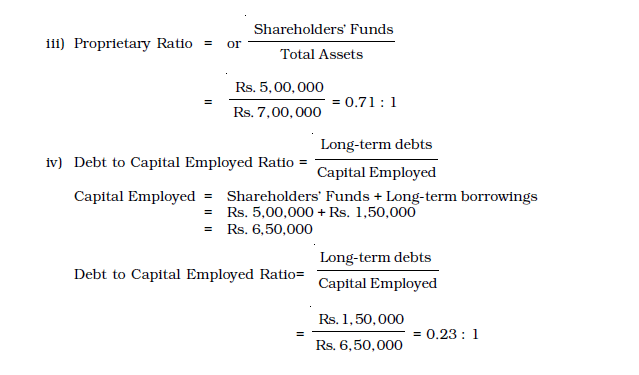
Illustration 10
The debt equity ratio of X Ltd. is 0.5 : 1. Which of the following would increase/ decrease or not change the debt equity ratio?
(i) Further issue of equity shares
(ii) Cash received from debtors
(iii) Sale of goods on cash basis
(iv) Redemption of debentures
(v) Purchase of goods on credit.
Solution
The change in the ratio depends upon the original ratio. Let us assume that external funds are Rs. 5,00,000 and internal funds are Rs. 10,00,000. Now we will analyse the effect of given transactions on debt equity ratio.
(i) Assume that Rs. 1,00,000 worth of equity shares are issued. This will increase the internal funds to Rs. 11,00,000. The new ratio will be 0.45 : 1 (5,00,000/11,00,000). Thus, it is clear that further issue of equity shares decreases the debt-equity ratio.
(ii) Cash received from debtors will leave the internal and external funds unchanged as this will only affect the composition of current assets. Hence, the debt-equity ratio will remain unchanged.
(iii) This will also leave the ratio unchanged as sale of goods on cash basis neither affect Debt nor equity.
(iv) Assume that Rs. 1,00,000 debentures are redeemed. This will decrease the long-term debt to Rs. 4,00,000. The new ratio will be 0.4 : 1 (4,00,000/10,00,000). Redemption of debentures will decrease the debit-equity ratio.
(v) This will also leave the ratio unchanged as purchase of goods on credit neither affect Debt nor equity.
5.7.5 Interest Coverage Ratio
It is a ratio which deals with the servicing of interest on loan. It is a measure of security of interest payable on long-term debt. It expresses the relationship between profits available for payment of interest and the amount of interest payable. It is calculated as follows:
Interest Coverage Ratio = Net Profit before Interest and Tax / Interest on long term debt
Significance:It reveals the number of times interest on long-term debts is covered by the profits available for interest. A higher ratio ensures safety of interest on debts.
Illustration 11
From the following details, calculate interest coverage ratio:
Net Profit after tax Rs. 60,000; 15% Long-term Debt 10,00,000; and Tax Rate 40%.
Solution
Net Profit after Tax = Rs. 60,000
Tax Rate = 40%
Net Profit before tax = Net profit after tax*100/(100 – Tax rate)
= Rs. 60,000 x 100/(100 – 40)
= Rs. 1,00,000
Interest on Long Term Debt = 15% of Rs. 10,00,000 = Rs. 1,50,000
Net profit before interest and tax = Net profit before tax + Interest
= Rs. 1,00,000 + Rs. 1,50,000 = Rs. 2,50,000
Interest Coverage Ratio = Net Profit before Interest and Tax/Interest on long term debt
= Rs. 2,50,000/Rs. 1,50,000
= 1.67 times.
5.8 Activity (or Turnover) Ratios
These ratios indicate the speed at which, activities of the business are being performed. The activity ratios express the number of times assets employed, or, for that matter, any constituent of assets, is turned into sales during an accounting period. Higher turnover ratio means better utilisation of assets and signifies improved efficiency and profitability, and as such are known as efficiency ratios. The important activity ratios calculated under this category are
1. Inventory Turnover;
2. Trade receivable Turnover;
3. Trade payable Turnover;
4. Investment (Net assets) Turnover
5. Fixed assets Turnover; and
6. Working capital Turnover.
5.8.1 Inventory Turnover Ratio
It determines the number of times inventory is converted into revenue from operations during the accounting period under consideration. It expresses the relationship between the cost of revenue from operations and average inventory. The formula for its calculation is as follows:
Inventory Turnover Ratio = Cost of Revenue from Operations / Average Inventory
Where average inventory refers to arithmetic average of opening and
closing inventory, and the cost of revenue from operations means revenue
from operations less gross profit.
Significance : It studies the frequency of conversion of inventory of finished goods into revenue from operations. It is also a measure of liquidity. It determines how many times inventory is purchased or replaced during a year. Low turnover of inventory may be due to bad buying, obsolete inventory, etc., and is a danger signal. High turnover is good but it must be carefully interpreted as it may be due to buying in small lots or selling quickly at low margin to realise cash. Thus, it throws light on utilisation of inventory of goods.
Test your Understanding – II
(i) The following groups of ratios primarily measure risk
A. liquidity, activity, and profitability
B. liquidity, activity, and inventory
C. liquidity, activity, and debt
D. liquidity, debt and profitability
(ii) The _________ ratios are primarily measures of return.
A. liquidity
B. activity
C. debt
D. profitability
(iii) The _________ of a business firm is measured by its ability to satisfy its short-term obligations as they come due.
A. activity
B. liquidity
C. debt
D. profitability
(iv) _________ ratios are a measure of the speed with which various accounts are converted into sales or cash.
A. Activity
B. Liquidity
C. Debt
D. Profitability
(v) The two basic measures of liquidity are
A. inventory turnover and current ratio
B. current ratio and liquid ratio
C. gross profit margin and operating ratio
D. current ratio and average collection period
(vi) The _________ is a measure of liquidity which excludes _______, generally the least liquid asset.
A. current ratio, trade receivable
B. liquid ratio, trade receivable
C. current ratio, inventory
D. liquid ratio, inventory
Illustration 12
From the following information, calculate stock turnover ratio :
Inventory in the beginning = 18,000
Inventory at the end = 22,000
Net purchases = 46,000
Wages = 14,000
Revenue from operations = 80,000
Carriage inwards = 4,000
Solution:
Inventory Turnover Ratio =
Cost of Revenue from Operations/Average Inventory
Cost of Revenue from Operations = Inventory in the beginning + Net
Purchases + Wages + Carriage inwards
– Inventory at the end
= Rs. 18,000 + Rs. 46,000 + Rs. 14,000
+ Rs. 4,000 – Rs. 22,000
= Rs. 60,000
Average Inventory =
Inventory in the beginning + Inventory at the end/2
=Rs. 18,000 + Rs. 22,000/2
= Rs. 20,000
Inventory Turnover Ratio =Rs. 60,000/Rs. 20,000= 3 Times
Illustration 13
From the following information, calculate inventory turnover ratio:
Rs.
Revenue from operations = 4,00,000
Average Inventory = 55,000
Gross Profit Ratio = 10%
Solution
Revenue from operations = Rs. 4,00,000
Gross Profit = 10% of Rs. 4,00,000 = Rs. 40,000
Cost of Revenue from operations = Revenue from operations – Gross Profit
= Rs. 4,00,000 – Rs. 40,000 = Rs. 3,60,000
Inventory Turnover Ratio =
Cost of Revenue from Operations/Average Inventory
= Rs. 3,60,000/Rs. 55,000
= 6.55 times
Illustration 14
A trader carries an average inventory of Rs. 40,000. His inventory turnover ratio is 8 times. If he sells goods at a profit of 20% on Revenue from operations, find out the gross profit.
Solution: Inventory Turnover Ratio =Cost of Revenue from Operations/ Average Inventory
8 = Cost of Revenue from Operations/ Rs. 40,000
∴ Cost of Revenue from operations = 8 × Rs. 40,000
= Rs. 3,20,000
Revenue from operations = Cost of Revenue from operations × 100/80
= Rs. 3,20,000 ×100/80 = Rs. 4,00,000
Gross Profit = Revenue from operations – Cost of Revenue from operations
= Rs. 4,00,000 – Rs. 3,20,000 = Rs. 80,000
Do it Yourself
1. Calculate the amount of gross profit:
Average inventory = Rs. 80,000
Inventory turnover ratio = 6 times
Selling price = 25% above cost
2. Calculate Inventory Turnover Ratio:
Annual Revenue from operations = Rs. 2,00,000
Gross Profit = 20% on cost of Revenue from operations
Inventory in the beginning = Rs. 38,500
Inventory at the end = Rs. 41,500
5.8.2 Trade Receivables Turnover Ratio
It expresses the relationship between credit revenue from operations and trade receivable. It is calculated as follows :
Trade Receivable Turnover ratio = Net Credit Revenue from Operations/Average Trade Receivable
Where Average Trade Receivable = (Opening Debtors and Bills Receivable + Closing Debtors and Bills Receivable)/2
It needs to be noted that debtors should be taken before making any provision for doubtful debts.
Significance: The liquidity position of the firm depends upon the speed with which trade receivables are realised. This ratio indicates the number of times the receivables are turned over and converted into cash in an accounting period. Higher turnover means speedy collection from trade receivable. This ratio also helps in working out the average collection period. The ratio is calculated by dividing the days or months in a year by trade receivables turnover ratio.
i.e.,Number of days or Months/ Trade receivables turnover ratio
Illustration 15
Calculate the Trade receivables turnover ratio from the following information:
Rs.
Total Revenue from operations 4,00,000
Cash Revenue from operations 20% of Total Revenue from operations
Trade receivables as at 1.4.2016 40,000
Trade receivables as at 31.3.2017 1,20,000
Solution
Trade Receivables Turnover Ratio =Net Credit Revenue from Operations/Average Trade Receivables
Credit Revenue from operations = Total revenue from operations – Cash revenue from operations
Cash Revenue from operations = 20% of Rs. 4,00,000
= Rs. 4,00,000 ×20/100 = Rs. 80,000
Credit Revenue from operations = Rs. 4,00,000 – Rs. 80,000 = Rs. 3,20,000
Average Trade Receivables = Opening Trade Receivables + Closing Trade Receivables/ 2
= Rs. 40,000 + Rs. 1,20,000/2
= Rs. 80,000
Trade Receivables Turnover Rations = Net Credit Revenue Form Operations/ Average Inventoary
Trade Receivables Turnover Ratio = Rs. 3,20,000/ Rs. 80,000
= 4 times.
5.8.3 Trade Payable Turnover RatioTrade payables turnover ratio indicates the pattern of payment of trade payable.
As trade payable arise on account of credit purchases, it expresses relationship between credit purchases and trade payable. It is calculated as follows:
Trade Payables Turnover ratio = Net Credit purchases/Average trade payable
Where Average Trade Payable = (Opening Creditors and Bills Payable +Closing Creditors and Bills Payable)/2
Average Payment Period = No. of days/month in a year/ Trade Payables Turnover Ratio
Significance : It reveals average payment period. Lower ratio means credit allowed by the supplier is for a long period or it may reflect delayed payment to suppliers which is not a very good policy as it may affect the reputation of the business. The average period of payment can be worked out by days/ months in a year by the Trade Payable Turnover Ratio.
Illustration 16Calculate the Trade payables turnover ratio from the following figures:
Rs. Credit purchases during 2016-17 = 12,00,000 Creditors on 1.4.2016 = 3,00,000 Bills Payables on 1.4.2016 = 1,00,000 Creditors on 31.3.2017 = 1,30,000 Bills Payables on 31.3.2017 = 70,000 Solution:Trade Payables Turnover Ratio = Net Credit Purchases / Average Trade Payables
Average Trade Payables = Creditors in the beginning + Bills payables in the beginning + Creditors at the end + Bills payables at the end / 2
= Rs. 3,00,000
∴ Trade Payables Turnover Ratio = Rs. 12,00,000 /Rs. 3,00,000
= 4 times
Illustration 17From the following information, calculate –
(i) Trade receivables turnover ratio
(ii) Average collection period
(iii) Trade rayable turnover ratio
(iv) Average payment period
Given :
Rs.Revenue from Operations 8,75,000
Creditors 90,000
Bills receivable 48,000
Bills payable 52,000
Purchases 4,20,000
Trade debtors 59,000
Solution:(i) Trade Receivables Turnover Ratio = Net Credit Revenue from operation Average Trade Receivable
= Rs. 8,75,000/ (Rs. 59,000 + Rs. 48,000)
= 8.18 times
This figure has not been divided by 2, in order to calculate average Trade Receivables as the figures of debtors and bills receivables in the beginning of the year are not available. So when only year-end figures are available use the same as it is.
(ii) Average Collection Period = 365/Trade Receivables Turnover Ratio
= 365/8.18
= 45 days
(iii) Trade Payable Turnover Ratio = Purchases */Average Trade Payables
= Purchases/Creditors + Bills payable
= 4,20,000/90,000 + 52,000
= 4,20,000 / 1,42,000
= 2.96 times
(iv) Average Payment Period =365/Trade Payables Turnover Ratio
= 365 /2.96
= 123 days
*Since no information regarding credit purchase is given, hence it will be related as net purchases.
5.8.4 Net Assets or Capital Employed Turnover Ratio
It reflects relationship between revenue from operations and net assets (capital employed) in the business. Higher turnover means better activity and profitability.
It is calculated as follows :
Net Assets or Capital Employed Turnover ratio = Revenue from Operation/Capital Employed
Capital employed turnover ratio which studies turnover of capital employed (or Net Assets) is analysed further by following two turnover ratios :
(a) Fixed Assets Turnover Ratio : It is computed as follows:
Fixed asset turnover Ratio =Net Revenue from Operation /Net Fixed Assets
(b) Working Capital Turnover Ratio : It is calculated as follows : Working Capital Turnover Ratio = Net Revenue from Operation/ Working Capital
Significance : High turnover of capital employed, working capital and fixed assets is a good sign and implies efficient utilisation of resources. Utilisation of capital employed or, for that matter, any of its components is revealed by the turnover ratios. Higher turnover reflects efficient utilisation resulting in higher liquidity and profitability in the business.
Illustration 18
From the following information, calculate (i) Net assets turnover, (ii) Fixed assets turnover, and (iii) Working capital turnover ratios :
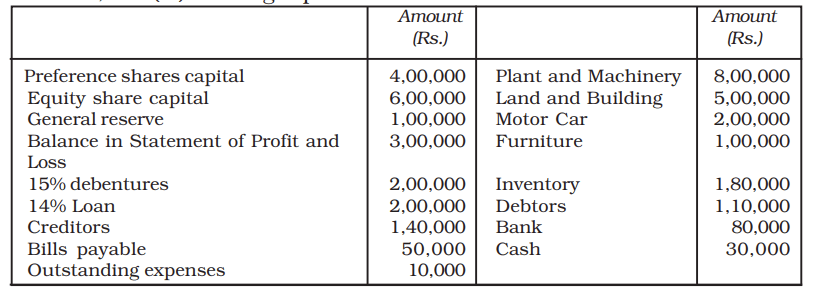
Revenue from operations for the year 2016-17 were Rs. 30,00,000
Solution:
Revenue from Operations = Rs. 30,00,000
Capital Employed = Share Capital + Reserves and
Surplus + Long-term Debts
(or Net Assets)
= (Rs.4,00,000 + Rs.6,00,000)
+ (Rs.1,00,000 + Rs.3,00,000)
+ (Rs.2,00,000 + Rs.2,00,000)
= Rs. 18,00,000
Fixed Assets = Rs.8,00,000 + Rs.5,00,000 + Rs.2,00,000
+ Rs.1,00,000 = Rs. 16,00,000
Working Capital = Current Assets – Current Liabilities
= Rs.4,00,000 – Rs.2,00,000 = Rs. 2,00,000
Net Assets Turnover Ratio = Rs.30,00,000/Rs.18,00,000 = 1.67 times
Fixed Assets Turnover Ratio = Rs.30,00,000/Rs.16,00,000 = 1.88 times
Working Capital Turnover Ratio = Rs.30,00,000/Rs.2,00,000 = 15 times
Test your Understanding – III
(i) The _________ is useful in evaluating credit and collection policies.
A. average payment period
B. current ratio
C. average collection period
D. current asset turnover
(ii) The ___________ measures the activity of a firm’s inventory.
A. average collection period
B. inventory turnover
C. liquid ratio
D. current ratio
(iii) The ___________ may indicate the firm is experiencing stock outs and lost sales.
A. average payment period
B. inventory turnover
C. average collection period
D. quick ratio
(vi) ABC Co. extends credit terms of 45 days to its customers. Its credit collection would be considered poor if its average collection period was
A. 30 days
B. 36 days
C. 47 days
D. 57 days
(v) ___________ are especially interested in the average payment period, since it provides them with a sense of the bill-paying patterns of the firm.
A. Customers
B. Stockholders
C. Lenders and suppliers
D. Borrowers and buyers
(vi) The __________ ratios provide the information critical to the long-run operation of the firm
A. liquidity
B. activity
C. solvency
D. profitability
5.9 Profitability Ratios
The profitability or financial performance is mainly summarised in Income statement. Profitability ratios are calculated to analyse the earning capacity of the business which is the outcome of utilisation of resources employed in the business. There is a close relationship between the profit and the efficiency with which the resources employed in the business are utilised. The various ratios which are commonly used to analyse the profitability of the business are:
1. Gross Profit Ratio
2. Operating Ratio
3. Operating Profit Ratio
4. Net profit Ratio
5. Return on Investment (ROI) or Return on Capital Employed (ROCE)
6. Return on Net Worth (RONW)
7. Earnings per Share
8. Book Value per Share
9. Dividend Payout Ratio
10. Price Earning Ratio.
5.9.1 Gross Profit Ratio
Gross profit ratio as a percentage of sales is computed to have an idea about gross margin. It is computed as follows:
Gross Profit Ratio = Gross Profit/Net Revenue of Operations 100
Significance: It indicates gross margin on products sold. It also indicates the margin available to cover operating expenses, non-operating expenses, etc. Change in gross profit ratio may be due to change in selling price or cost of revenue from operations or a combination of both. A low ratio may indicate unfavourable purchase and sales policy. Higher gross profit ratio is always a good sign.
Illustration 19
Following information is available for the year 2016-17, calculate gross profit ratio:
Rs
Revenue from Operations:Cash 25,000
:Credit 75,000
Purchases : Cash 15,000
Credit 60,000
Carriage Inwards 2,000
Salaries 25,000
Decrease in Inventory 10,000
Return Outwards 2,000
Wages 5,000
Solution
Revenue from Operations = Cash Revenue from Operations + Credit Revenue from Opration
= Rs.25,000 + Rs.75,000 = Rs. 1,00,000
Net Purchases = Cash Purchases + Credit Purchases – Return Outwards
= Rs.15,000 + Rs.60,000 – Rs.2,000 = Rs. 73,000
Cost of Revenue from Operations = Purchases + (Opening Inventory – Closing Inventory) + Direct Expenses
= Purchases + Decrease in inventory + Direct Expenses
= Rs.73,000 + Rs.10,000 + (Rs.2,000 + Rs.5,000)
= Rs.90,000
Gross Profit = Revenue from Operations – Cost of Revenue from
Operation
= Rs.1,00,000 – Rs.90,000
= Rs. 10,000
Gross Profit Ratio = Gross Profit/Net Revenue from Operations ×100
= Rs.10,000/Rs.1,00,000 × 100
= 10%.
5.9.2 Operating Ratio
It is computed to analyse cost of operation in relation to revenue from operations. It is calculated as follows:
Operating Ratio = (Cost of Revenue from Operations + Operating Expenses)/ Net Revenue from Operations ×100
Operating expenses include office expenses, administrative expenses, selling expenses and depreciation and employee benefit expenses etc.
Cost of operation is determined by excluding non-operating incomes and expenses such as loss on sale of assets, interest paid, dividend received, loss by fire, speculation gain and so on.
5.9.3 Operating Profit Ratio
It is calculated to reveal operating margin. It may be computed directly or as a residual of operating ratio.
Operating Profit Ratio = 100 – Operating Ratio
Alternatively, it is calculated as under:
Operating Profit Ratio = Operating Profit/ Revenue from Operations × 100
Where Operating Profit = Revenue from Operations – Operating Cost
Significance: Operating ratio is computed to express cost of operations excluding financial charges in relation to revenue from operations. A corollary of it is ‘Operating Profit Ratio’. It helps to analyse the performance of business and throws light on the operational efficiency of the business. It is very useful for inter-firm as well as intra-firm comparisons. Lower operating ratio is a very healthy sign.
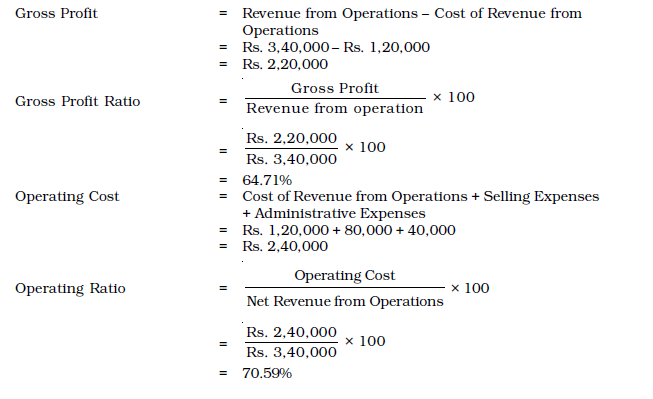
Illustration 20
Given the following information:
Revenue from Operations Rs 3,40,000
Cost of Revenue from Operations Rs1,20,000
Selling expenses Rs 80,000
Administrative Expenses Rs 40,000
Calculate Gross Profit Ratio and Operation Ratio.
Solution
5.9.4 Net Profit Ratio
Net Profit Ratio is based on all inclusive concept of profit. It relates sales to net profit after operational as well as non-operational expenses and incomes. It is calculated as under:
Net Profit Ratio = Net profit / Revenue from Operations × 100
Generally, net profit refers to Profit after Tax (PAT).
Significance: It is a measure of net profit margin in relation to revenue from operations. Besides revealing profitability, it is the main variable in computation of Return on Investment. It reflects the overall efficiency of the business, assumes great significance from the point of view of investors.
Illustration 21
Gross profit ratio of a company was 25%. Its credit sales was Rs. 20,00,000 and its cash sales was 10% of the total sales. If the indirect expenses of the company were Rs. 50,000, calculate its net profit ratio.
Solution
Cash Revenue from Operations = Rs.20,00,000 × 10/90
= Rs.2,22,222
Hence, total Revenue from Operations are = Rs.22,22,222
Gross profit = 0.25 × 22,22,222 = Rs. 5,55,555
Net profit = Rs.5,55,555 – 50,000
= Rs.5,05,555
Net profit ratio = Net profit/Revenue from Operations
× 100
= Rs.5,05,555/Rs.22,22,222 × 100
= 22.75%.
5.9.5 Return on Capital Employed or Investment
It explains the overall utilisation of funds by a business enterprise. Capital employed means the long-term funds employed in the business and includes shareholders’ funds, debentures and long-term loans. Alternatively, capital employed may be taken as the total of non-current assets and working capital. Profit refers to the Profit Before Interest and Tax (PBIT) for computation of this ratio. Thus, it is computed as follows:
Return on Investment (or Capital Employed) = Profit before Interest and Tax/ Capital Employed × 100
Significance: It measures return on capital employed in the business. It reveals the efficiency of the business in utilisation of funds entrusted to it by shareholders, debenture-holders and long-term loans. For inter-firm comparison, return on capital employed funds is considered a good measure of profitability. It also helps in assessing whether the firm is earning a higher return on capital employed as compared to the interest rate paid.
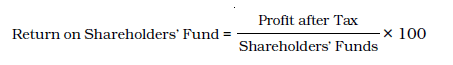
5.9.6 Return on Shareholders’ Fund
This ratio is very important from shareholders’ point of view in assessing whether their investment in the firm generates a reasonable return or not. It should be higher than the return on investment otherwise it would imply that company’s funds have not been employed profitably.
A better measure of profitability from shareholders point of view is obtained by determining return on total shareholders’ funds, it is also termed as Return
5.9.7 Earnings Per Share
The ratio is computed as:
EPS = Profit available for equity shareholders/Number of Equity Shares In this context, earnings refer to profit available for equity shareholders which is worked out as
Profit after Tax – Dividend on Preference Shares.
This ratio is very important from equity shareholders point of view and also for the share price in the stock market. This also helps comparison with other to ascertain its reasonableness and capacity to pay dividend.5.9.8 Book Value Per Share
This ratio is calculated as :
Book Value per share = Equity shareholders’ funds/Number of Equity Shares
Equity shareholder funds refer to Shareholders Funds – Preference Share Capital. This ratio is again very important from equity shareholders point of view as it gives an idea about the value of their holding and affects market price of the shares.
5.9.9 Dividend Payout Ratio
This refers to the proportion of earning that are distributed against the shareholders. It is calculated as –
Dividend Payout Ratio =![]()
This reflects company’s dividend policy and growth in owner’s equity.
5.9.10 Price Earning Ratio
The ratio is defined as –P/E Ratio = Market price of a Share/Earnings per Share
For example, if the EPS of X Ltd. is Rs. 10 and market price is Rs. 100, the price earning ratio will be 10 (100/10). It reflects investors expectation about the growth in the firm’s earnings and reasonableness of the market price of its shares. P/E Ratio vary from industy to industry and company to company in the same industry depending upon investors perception of their future.
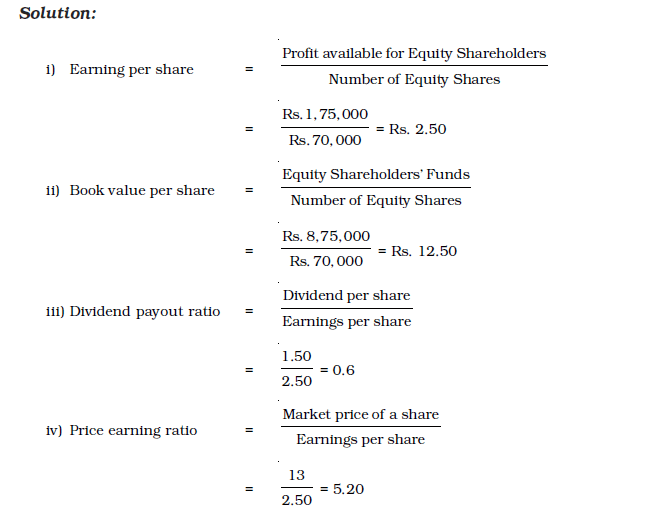
Illustration 22
From the following details, calculate Return on Investment:
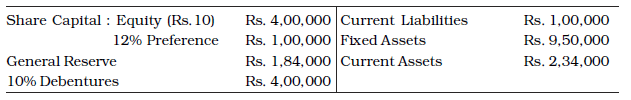
Also calculate Return on Shareholders’ Funds, EPS, Book value per share and P/E ratio if the market price of the share is Rs. 34 and the net profit after tax was Rs. 1,50,000, and the tax had amounted to Rs. 50,000.
Solution
|
Profit before interest and tax |
= Rs. 1,50,000 + Debenture interest + Tax |
| = Rs. 1,50,000 + Rs. 40,000 + Rs. 50,000 | |
| = Rs.2,40,000 | |
| Capital Employed | = Equity Share Capital + Preference Share Capital + Reserves + Debentures |
| = Rs. 4,00,000 + Rs.1,00,000 + Rs. 1,84,000 + Rs. 4,00,000 = Rs. 10,84,000 | |
| Return on Investment | |
|
= Profit before Interest and Tax/
Capital Employed × 100
= Rs. 2,40,000/Rs. 10,84,000 × 100 |
|
| = 22.14% | |
| Shareholders’ Fund | = Equity Share Capital + Preference Share Capital + General Reserve |
| = Rs. 4,00,000 + Rs. 1,00,000 + Rs. 1,84,000 | |
| = Rs. 6,84,000 | |
| Return on Shareholders’ Funds |
= Profit after tax/shareholders’ Funds × 100 = Rs. 1,50,000/Rs. 6,84,000 × 100 = 21.93% |
| EPS | = Profit available for Equity Shareholders/
Number of Equity Shares
= Rs. 1,38,000/ 40,000 = Rs. 3.45 |
| Preference Share Dividend | = Rate of Dividend × Prefence Share Capital = 12% of Rs. 1,00,000 = Rs. 12,000 |
| Profit available to equity Shareholders | = Profit after Tax – Preference dividend on preference shares |
| where, Dividend on Prefrence | = Rate of Dividend × Preference Share Capital |
| Share | = 12% of Rs. 1,00,000 |
= Rs.12,000 = Rs. 1,50,000 – Rs. 12,000 = Rs. 1,38,000 |
|
| P/E Ratio | =
Market price of a share/ Earnings per share =34/3.45 = 9.86 Times |
| Book Value per share | = Equity Shareholders’ fund/No. of equity shares |
| where, Number of Equity Shares | = Equity share capital Face value per share |
| = Rs. 4,00,000/Rs.10 | |
| = 40,000 shares | |
| Hence, Book value per share | =Rs. 5,84,000/40,000 shares
= Rs. 14.60 |
It may be noted that various ratios are related with each other. Sometimes, the combined information regarding two or more ratios is given and missing figures may need to be calculated. In such a situation, the formula of the ratio will help in working out the missing figures (See Illsuatration 23 and 24).
Illustration 23
Calculate current assets of a company from the following information:
Stock turnover ratio = 4 times
Stock at the end is Rs. 20,000 more than the stock in the beginning.
Sales Rs. 3,00,000 and gross profit ratio is 20% of sales.
Current liabilities = Rs. 40,000
Quick ratio = 0.75: 1
Solution
Cost of Revenue from Operations = Revenue from Operations – Gross Profit
= Rs. 3,00,000 – (Rs. 3,00,000 × 20%)
= Rs. 3,00,000 – Rs. 60,000
= Rs. 2,40,000
Inventory Turnover Ratio = Cost of Revenue from Operations/ Average Inventory
Average Inventory = Cost of Revenue from Operations/4
= Rs. 2,40,000/4 = Rs. 60,000
Average Inventory = (Opening inventory + Closing inventory)/2
Rs. 60,000 = Opening inventory + (Opening inventory
+Rs.20,000)/2
Rs. 60,000 = Opening inventory + Rs. 10,000
Opening Inventory = Rs. 50,000
Closing Inventory = Rs. 70,000
Liquid Ratio = Liquid assets/current liabilities
0.75 = Liquid assets/Rs. 40,000
Liquid Assets = Rs. 40,000 × 0.75 = Rs. 30,000
Current Assets = Liquid assets + Closing inventory
= Rs. 30,000 + Rs. 70,000 = Rs. 1,00,000
Illustration 24
The current ratio is 2.5:1. Current assets are Rs. 50,000 and current liabilities are Rs. 20,000. How much must be the decline in the current assets to bring the ratio to 2:1.
Solution
Current liabilities = Rs. 20,000
For a ratio of 2:1, the current assets must be 2 × 20,000 = Rs. 40,000
Present level of current assets = Rs. 50,000
Necessary decline = Rs. 50,000 – Rs. 40,000 = Rs. 10,000.
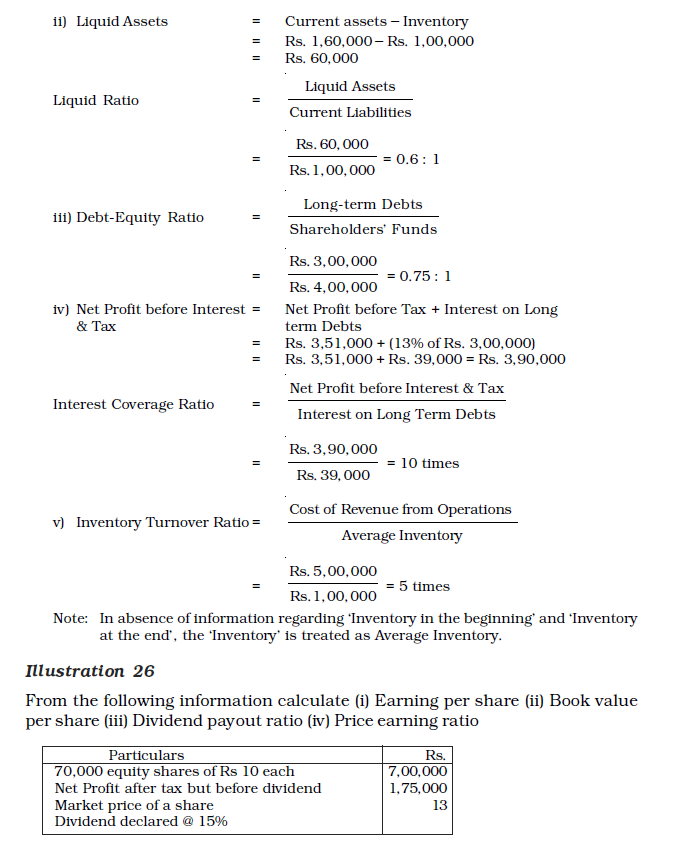
Illustration 25
Following information is given by a company from its books of accounts as on March 31, 2017:
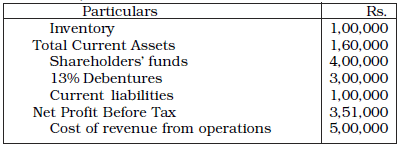
Calculate:
i) Current Ratio
ii) Liquid Ratio
iii) Debt Equity Ratio
iv) Interest Coverage Ratio
v) Inventory Turnover Ratio
Solution
Terms Introduced in the Chapter
1. Ratio Analysis
2. Liquidity Ratios
3. Solvency Ratios
4. Activity Ratios
5. Profitability Ratios
6. Return on Investment (ROI)
7. Quick Assets
8. Shareholders Funds (Equity)
9. Return on Net Worth
10. Average Collection Period
11. Trade Receivables
12. Turnover Ratios
13. Efficiency Ratios
14. Dividend Payout
Summary
Ratio Analysis: An important tool of financial statement analysis is ratio analysis. Accounting ratios represent relationship between two accounting numbers.
Objective of Ratio Analysis: The objective of ratio analysis is to provide a deeper analysis of the profitability, liquidity, solvency and activity levels in the business. It is also to identify the problem areas as well as the strong areas of the business.
Advantages of Ratio Analysis: Ratio analysis offers many advantages including enabling financial statement analysis, helping understand efficacy of decisions, simplifying complex figures and establish relationships, being helpful in comparative analysis, identification of problem areas, enables SWOT analysis, and allows various comparisons.
Limitations of Ratio Analysis:There are many limitations of ratio analysis. Few are based because of the basic limitations of the accounting data on which it is based. In the first set are included factors like Historical Analysis, Ignores Price-level Changes, Ignore Qualitative or Non-monetary Aspects, Limitations of Accounting Data, Variations in Accounting Practices, and Forecasting. In the second set are included factor like means and not the end, lack of ability to resolve problems, lack of standardised definitions, lack of universally accepted standard levels, and ratios based on unrelated figures.
Types of Ratios: There are many types of ratios, viz., liquidity, solvency, activity and profitability ratios. The liquidity ratios include current ratio and acid test ratio. Solvency ratios are calculated to determine the ability of the business to service its debt in the long run instead of in the short run. They include debt equity ratio, total assets to debt ratio, proprietary ratio and interest coverage ratio. The turnover ratios basically exhibit the activity levels characterised by the capacity of the business to make more sales or turnover and include Inventory Turnover, Trade Receivables Turnover, Trade Payables Turnover, Working Capital Turnover, Fixed Assets Turnover and Current assets Turnover. Profitability ratios are calculated to analyse the earning capacity of the business which is the outcome of utilisation of resources employed in the business. The ratios include Gross Profit ratio, Operating ratio, Net Profit Ratio, Return on investment (Capital employed), Earnings per Share, Book Value per Share, Dividend per Share and Price/Earning ratio.
Question for Practice
A. Short Answer Questions
1. What do you mean by Ratio Analysis?
2. What are various types of ratios?
3. What relationships will be established to study:
a. Inventory Turnover
b. Trade receivables turnover
c. Trade payables turnover
d. Working Capital Turnover.
4. The liquidity of a business firm is measured by its ability to satisfy its long-term obligations as they become due. What are the ratios used for this purpose?
5. The average age of inventory is viewed as the average length of time inventory is held by the firm for which explain with reasons.
Long Answer Questions
1. What are liquidity ratios? Discuss the importance of current and liquid ratio.
2. How would you study the Solvency position of the firm?
3. What are various profitability ratios? How are these worked out?
4. The current ratio provides a better measure of overall liquidity only when a firm’s inventory cannot easily be converted into cash. If inventory is liquid, the quick ratio is a preferred measure of overall liquidity. Explain.
Numerical Questions
1. Following is the Balance Sheet of Raj Oil Mills Limited as at March 31, 2017.
Calculate current ratio.
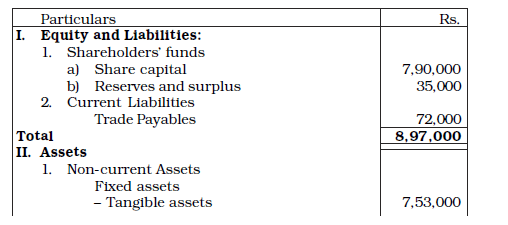
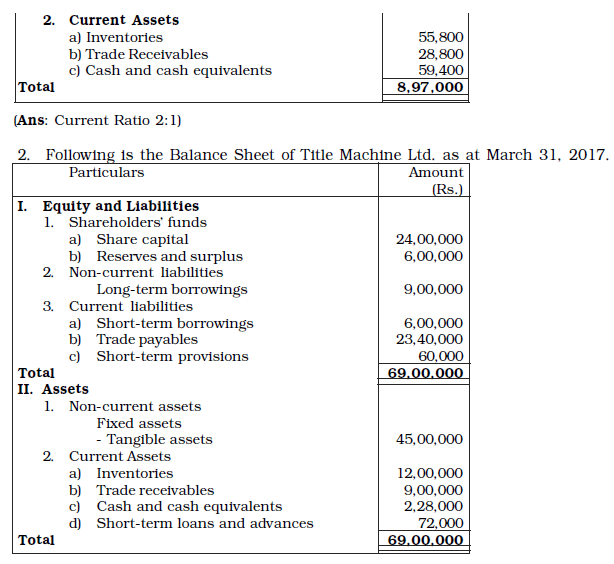
Calculate Current Ratio and Liquid Ratio.
(Ans: Current Ratio 0.8 : 1, Liquid Ratio 0.4 : 1)
3. Current Ratio is 3.5 : 1. Working Capital is Rs. 90,000. Calculate the amount of Current Assets and Current Liabilities.
(Ans: Current Assets Rs. 1,26,000 and Current Liabilities Rs. 36,000)
4. Shine Limited has a current ratio 4.5 : 1 and quick ratio 3 : 1; if the inventory is 36,000, calculate Current Liabilities and Current Assets.
(Ans: Current Assets Rs. 1,08,000, Current Liabilities Rs. 24,000)
5. Current Liabilities of a company are Rs. 75,000. If current ratio is 4:1 and Liquid Ratio is 1 : 1, calculate value of Current Assets, Liquid Assets and Inventory. (Ans: Current Assets Rs. 3,00,000, Liquid Assets Rs. 75,000 and Inventory Rs. 2,25,000)
6. Handa Ltd.has stock of Rs. 20,000. Total liquid assets are Rs. 1,00,000 and quick ratio is 2:1. Calculate current ratio.
(Ans: Current Ratio 2.4:1)
7. Calculate debt equity ratio from the following information:
Total Assets Rs. 15,00,000
Current Liabilities Rs. 6,00,000
Total Debts Rs. 12,00,000
(Ans: Debt Equity Ratio 2:1.)
8. Calculate Current Ratio if:
Stock is Rs. 6,00,000; Liquid Assets Rs. 24,00,000; Quick Ratio 2:1.
(Ans: Current Ratio 2.5:1)
9. Compute Inventory Turnover Ratio from the following information:
Net Revenue from Operations Rs. 2,00,000
Gross Profit Rs. 50,000
Inventory at the end Rs. 60,000
Excess of inventory at the end over
inventory in the beginning Rs. 20,000
(Ans: Inventory Turnover Ratio 3 times)
10. Calculate following ratios from the following information:
(i) Current ratio (ii) Liquid ratio (iii) Operating Ratio (iv) Gross profit ratio
Current Assets Rs. 35,000
Current Liabilities Rs. 17,500
Inventory Rs. 15,000
Operating Expenses Rs. 20,000
Revenue from Operations Rs. 60,000
Cost of Revenue from operation Rs. 30,000
(Ans: Current Ratio 2 : 1; Liquid Ratio 1.14 : 1; Operating Ratio 83.3%; Gross
Profit Ratio 50%)
11. From the following information calculate:
(i) Gross Profit Ratio (ii) Inventory Turnover Ratio (iii) Current Ratio (iv) Liquid Ratio (v) Net Profit Ratio (vi) Working Capital Ratio:
Ratio (v) Net Profit Ratio (vi) Working Capital Ratio:
Revenue from Operations Rs. 25,20,000
Net Profit Rs. 3,60,000
Cost of Revenue from Operations Rs. 19,20,000
Long-term Debts Rs. 9,00,000
Trade Payables Rs. 2,00,000
Average Inventory Rs. 8,00,000
Liquid Assets Rs. 7,60,000
Fixed Assets Rs. 14,40,000
Current Liabilities Rs. 6,00,000
Net Profit before Interest and Tax Rs. 8,00,000
(Ans: Gross Profit Ratio 23.81%; Inventory Turnover Ratio 2.4 times; Current Ratio 2.6 : 1; Liquid Ratio 1.27 : 1; Net Profit Ratio 14.29%; Working Capital Ratio 2.625 times)
12. Compute Working Capital Turnover Ratio, Debt Equity Ratio and Proprietary Ratio from the following information:
Paid-up Capital Rs. 5,00,000
Current Assets Rs. 4,00,000
Revenue from Operations Rs. 10,00,000
13% Debentures Rs. 2,00,000
Current Liability Rs. 2,80,000
(Ans: Working Capital Ratio 8.33 times; Debt–Equity Ratio 0.4 : 1; Proprietary Ratio 0.71 : 1)
13. Calculate Inventory Turnover Ratio if: Inventory in the beginning is Rs. 76,250, Inventory at the end is Rs. 98,500, Sales is Rs. 5,20,000, Sales Return is Rs. 20,000, Purchases is Rs. 3,22,250. (Ans: Inventory Turnover Ratio 3.43 times)
14. . Calculate Inventory Turnover Ratio from the data given below:
Inventory in the beginning of the year 10,000
Inventory at the end of the year 5,000
Carriage Rs. 2,500
Revenue from Operations Rs. 50,000
Purchases Rs. 25,000
(Ans: Inventory Turnover Ratio 4.33 times)
15. A trading firm’s average inventory is Rs. 20,000 (cost). If the inventory turnover ratio is 8 times and the firm sells goods at a gross profit of 20% on sales, ascertain the gross profit of the firm.
(Ans: Profit Rs. 40,000)
16. You are able to collect the following information about a company for two years:
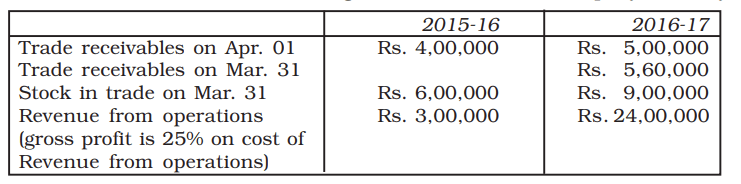
Calculate Inventory Turnover Ratio and Trade Receivables Turnover Ratio
(Ans: 2015-16: Inventory Turnover Ratio 2.67 times, Trade Receivables Turnover Ratio 4.41 times), 2016-17: Inventory Turnover Ratio 2.13 times Trade Receivable Turn over Ratio 4.53 times.
17. From the following Balance Sheet and other information, calculate following ratios:
(i) Debt-Equity Ratio (ii) Working Capital Turnover Ratio (iii) Trade Receivables Turnover Ratio
Balance Sheet as at March 31, 2017
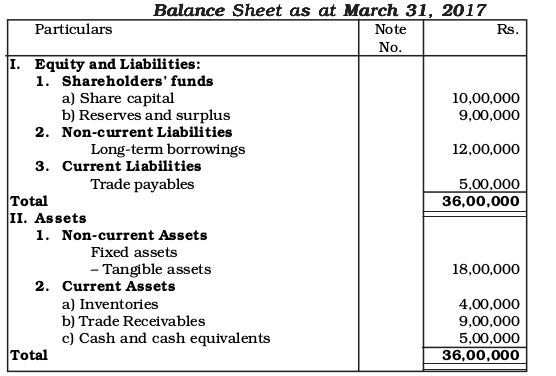
Additional Information: Revenue from operations 18,00,000
(Ans: Debt-Equity Ratio 0.63 : 1; Working Capital Turnover Ratio 1.38 times; Trade Receivables Turnover Ratio 2 times)
18. From the following information, calculate the following ratios:
(i) Liquid Ratio
(ii) Inventory turnover ratio
(iii) Return on investment
| Rs. | |
| Inventory in the beginning | 50,000 |
| Inventory at the end | 60,000 |
| Net Profit | 2,17,900 |
| 10% Debentures | 2,50,000 |
| Revenue from operations | 4,00,000 |
| Gross Profit | 1,94,000 |
| Cash and Cash Equivalents | 40,000 |
| Money received against share warrants | 20,000 |
| Trade Receivables | 1,00,000 |
| Trade Payables | 1,90,000 |
| Other Current Liabilities | 70,000 |
| Share Capital | 2,00,000 |
| Reserves and Surplus | 1,20,000 |
(Balance in the Statement of Profit & Loss) (Ans: Liquid Ratio 0.54 : 1; Inventory Turnover Ratio 3.75 times; Return on Investment 41.17%)
19. From the following, calculate (a) Debt-Equity Ratio (b) Total Assets to Debt Ratio (c) Proprietary Ratio.
Equity Share Capital Rs. 75,000
Share application money pending allotment Rs. 25,000
General Reserve Rs. 45,000
Balance in the Statement of Profit & Loss Rs. 30,000
Debentures Rs. 75,000
Trade Payables Rs. 40,000
Outstanding Expenses Rs. 10,000
(Ans: Debt-Equity Ratio 0.43 : 1; Total Assets to Debt Ratio 4 : 1; Proprietary Ratio 0.58 : 1)
20. Cost of Revenue from Operations is Rs. 1,50,000. Operating expenses are Rs. 60,000. Revenue from Operations is Rs. 2,50,000. Calculate Operating Ratio.
(Ans: Operating Ratio 84%)
21. Calculate the following ratio on the basis of following information:
(i) Gross Profit Ratio (ii) Current Ratio (iii) Acid Test Ratio (iv) Inventory Turnover
Ratio (v) Fixed Assets Turnover Ratio
Rs.
Gross Profit 50,000
Revenue from Operations 1,00,000
Inventory 15,000
Trade Receivables 27,500
Cash and Cash Equivalents 17,500
Current Liablilites 40,000
Land & Building 50,000
Plant & Machinery 30,000
Furniture 20,000
(Ans: (i) Gross Profit Ratio 50%; (ii) Current Ratio 1.5:1; (iii) Liquid Ratio 1.125 : 1,
Inventory Turnover Ratio 3.33 times; (iv) Fixed Assets Turnover Ratio 1 : 1)
22. From the following information calculate Gross Profit Ratio, Inventory Turnover Ratio and Trade Receivable Turnover Ratio.
Revenue from Operations Rs. 3,00,000
Cost of Revenue from Operations Rs. 2,40,000
Inventory at the end Rs. 62,000
Gross Profit Rs. 60,000
Inventory in the beginning Rs. 58,000
Trade Receivables Rs. 32,000
(Ans: Gross Profit Ratio 20%; Inventory Turnover Ratio 4 times; Trade
Receivables Turnover Ratio 9.4 times)
Answers to Test your Understanding
Test your Understanding – I
(a) F, (b) T, (c) T, (d) F, (e) T, (F) F
Test your Understanding – II
(i) D, (ii) D, (iii) B, (iv) A, (v) B, (vi) D
Test your Understanding – III
(i) C, (ii) B, (iii) B, (iv) C, (v) C, (vi) C