Table of Contents
Unit-II
Chapter-3
Population Composition
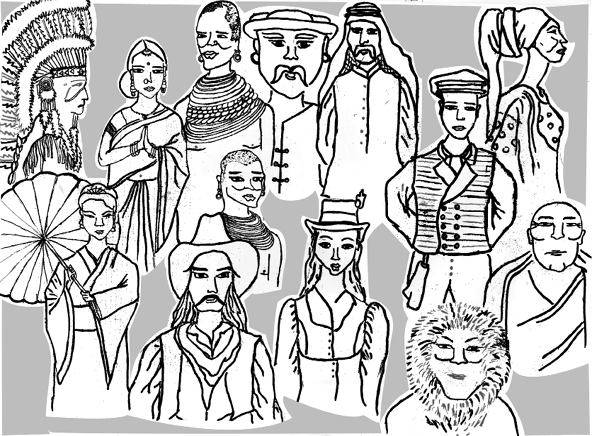
People of any country are diverse in many respects. Each person is unique in her/his own way. People can be distinguished by their age, sex and their place of residence. Some of the other distinguishing attributes of the population are occupation, education and life expectancy.
Sex Composition
The number of women and men in a country is an important demographic characteristic. The ratio between the number of women and men in the population is called the Sex Ratio. In some countries it is calculated by using the formula:

or the number of males per thousand females.
In India, the sex ratio is worked out using the formula:

or the number of females per thousand males.
The sex ratio is an important information about the status of women in a country.
In regions where gender discrimination is rampant, the sex ratio is bound to be unfavourable to women. Such areas are those where the practice of female foeticide, female infanticide and domestic violence against women are prevalent. One of the reasons could be lower socio-economic status of women in these areas. You must remember that more women in the population does not mean they have a better status. It could be that the men might have migrated to other areas for employment.
Natural Advantage v/s Social Disadvantage
Females have a biological advantage over males as they tend to be more resilient than males yet this advantage is cancelled out by the social disadvantages and discriminations that they face.
On an average, the world population reflects a sex ratio of 102 males per 100 females. The highest sex ratio in the world has been recorded in Latvia where there are 85 males per 100 females. In contrast, in Qatar there are 311 males per 100 females.
The world pattern of sex ratio does not exhibit variations in the developed regions of the world. The sex ratio is favourable for females in 139 countries of the world and unfavourable for them in the remaining 72 countries listed by the United Nations.
In general, Asia has a low sex ratio. Countries like China, India, Saudi Arabia, Pakistan, Afghanistan have a lower sex ratio.
On the other extreme is greater part of Europe (including Russia) where males are in minority. A deficit of males in the populations of many European countries is attributed to better status of women, and an excessively male-dominated out-migration to different parts of the world in the past.
Age Structure
Age structure represents the number of people of different age groups. This is an important indicator of population composition, since a large size of population in the age group of 15-59 indicates a large working population. A greater proportion of population above 60 years represents an ageing population which requires more expenditure on health care facilities. Similarly high proportion of young population would mean that the region has a high birth rate and the population is youthful.
Age-Sex Pyramid
The age-sex structure of a population refers to the number of females and males in different age groups. A population pyramid is used to show the age-sex structure of the population.
The shape of the population pyramid reflects the characteristics of the population. The left side shows the percentage of males while the right side shows the percentage of women in each age group.
Fig. 3.1, 3.2 and 3.3 show different types of population pyramids.
Expanding Populations
The age-sex pyramid of Nigeria as you can see is a triangular shaped pyramid with a wide base and is typical of less developed countries. These have larger populations in lower age groups due to high birth rates. If you construct the pyramids for Bangladesh and Mexico, it would look the same.
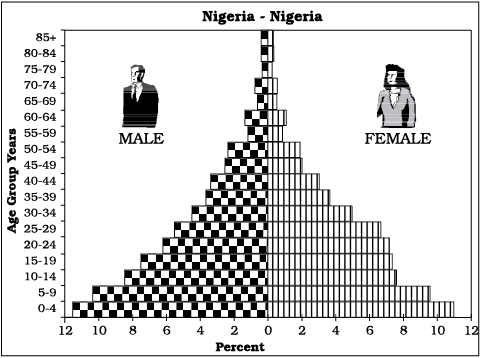
Source: Demographic Year Book, 2009-10
Fig. 3.1: Expanding Population
Constant Population
Australia’s age-sex pyramid is bell shaped and tapered towards the top. This shows birth and death rates are almost equal leading to a near constant population.
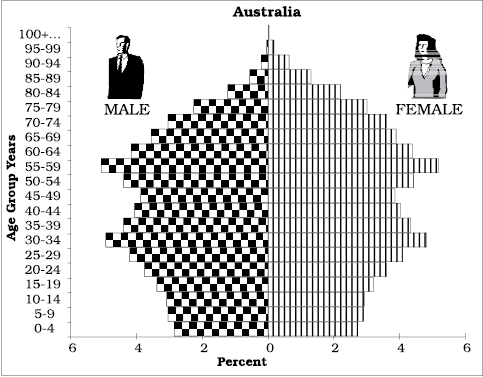
Source: Demographic Year Book, 2009-10
Fig. 3.2: Constant Population
Declining Populations
The Japan pyramid has a narrow base and a tapered top showing low birth and death rates. The population growth in developed countries is usually zero or negative.
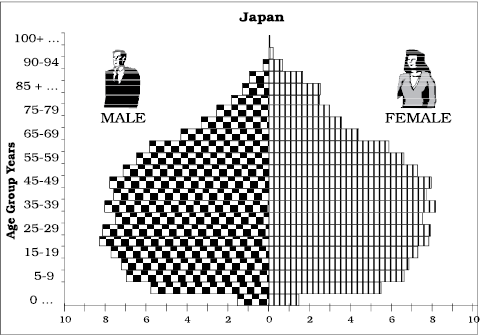
Source: Demographic Year Book, 2009-10
Fig. 3.3: Declining Population

Draw a population pyramid of the children in your school and describe its characteristics.
Ageing Population
Population ageing is the process by which the share of the older population becomes proportionally larger. This is a new phenomenon of the twentieth century. In most of the developed countries of the world, population in higher age groups has increased due to increased life expectancy. With a reduction in birth rates, the proportion of children in the population has declined.
Rural Urban Composition
The division of population into rural and urban is based on the residence. This division is necessary because rural and urban life styles differ from each other in terms of their livelihood and social conditions. The age-sex-occupational structure, density of population and level of development vary between rural and urban areas.
The criteria for differentiating rural and urban population varies from country to country. In general terms rural areas are those where people are engaged in primary activities and urban areas are those when majority of the working population is engaged in non-primary activities.
Fig. 3.4 shows rural urban sex composition of selected countries. The rural and urban differences in sex ratio in Canada and West European countries like Finland are just the opposite of those in African and Asian countries like Zimbabwe and Nepal respectively. In Western countries, males outnumber females in rural areas and females outnumber the males in urban areas. In countries like Nepal, Pakistan and India the case is reverse. The excess of females in urban areas of U.S.A., Canada and Europe is the result of influx of females from rural areas to avail of the vast job opportunities. Farming in these developed countries is also highly mechanised and remains largely a male occupation. By contrast the sex ratio in Asian urban areas remains male dominated due to the predominance of male migration. It is also worth noting that in countries like India, female participation in farming activity in rural area is fairly high. Shortage of housing, high cost of living, paucity of job opportunities and lack of security in cities, discourage women to migrate from rural to urban areas.
Literacy
Proportion of literate population of a country in an indicator of its socio-economic development as it reveals the standard of living, social status of females, availability of educational facilities and policies of government. Level of economic development is both a cause and consequence of literacy. In India – literacy rate denotes the percentage of population above 7 years of age, who is able to read, write and have the ability to do arithmetic calculations with understanding.
Occupational Structure
The working population (i.e. women and men of the age group – 15 to 59) take part in various occupations ranging from agriculture, forestry, fishing, manufacturing construction, commercial transport, services, communication and other unclassified services.
Agriculture, forestry, fishing and mining are classified as primary activities manufacturing as secondary, trade, transport, communication and other services as tertiary and the jobs related to research, information technology and developing ideas as quaternary activities. The proportion of working population engaged in these four sectors is a good indicator of the levels of economic development of a nation. This is because only a developed economy with industries and infrastructure can accommodate more workers in the secondary, tertiary and quaternary sector. If the economy is still in the primitive stages, then the proportion of people engaged in primary activities world be high as it involves extraction of natural resources.
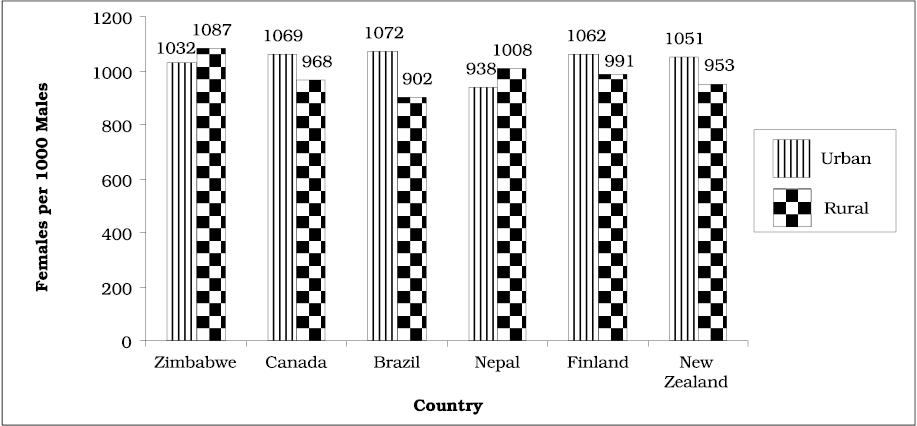
Fig. 3.4: Rural Urban Sex Composition (Selected Countries)
EXERCISES
1. Choose the right answer from the four alternatives given below.
(i) Which one of the following has caused the sex ratio of the United Arab Emirates to be low?
(a) Selective migration of male working population
(b) High birth rate of males
(c) Low birth rate of females
(d) High out migration of females
(ii) Which one of the following figures represents the working age group of the population?
(a) 15 to 65 years (c) 15 to 66 years
(b) 15 to 64 years (d) 15 to 59 years
(iii) Which one of the following countries has the highest sex ratio in the world?
(a) Latvia (c) Japan
(b) United Arab Emirates (d) France
2. Answer the following questions in about 30 words.
(i) What do you understand by population composition?
(ii) What is the significance of age-structure?
(iii) How is sex-ratio measured?
3. Answer the following questions in not more than 150 words.
(i) Describe the rural-urban composition of the population.
(ii) Discuss the factors responsible for imbalances in the sex-age found in different parts of the world and occupational structure.
Project/Activity
Construct an age-sex pyramid for your district/state.

