Graph the solution sets of the following inequations:
x + 2y>1
Given x + 2y>1
⇒ 2y>1 - x
⇒![]()
Consider the equation ![]()
Finding points on the coordinate axes:
If x = 0, the y value is ![]() i.e., y = 4
i.e., y = 4
⇒ the point on the Y axis is A(0,![]() )
)
If y = 0, x = 1
The point on the X axis is B(1,0)
Plotting the points on the graph: fig. 3a
Now consider the inequality ![]()
Here we need the y value greater than ![]()
⇒ the required region is above point A.
Also , the line AB is represented in dotted line. This is s done because ![]()
Therefore the graph of the inequation ![]() is fig. 3b
is fig. 3b

Fig 3a
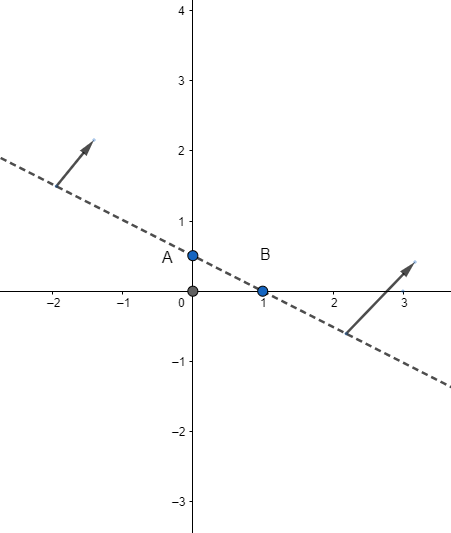
Fig 3b
1