Graph the solution sets of the following inequations:
y - 2≤3x
Given y - 2≤3x
⇒ y≤3x + 2
Consider the equation y = 3x + 2
Finding points on the coordinate axes:
If x = 0, the y value is 2 i.e, y = 2
⇒ the point on Y axis is A(0,2)
If y = 0, 0 = 3x + 2
⇒x = ![]()
The point on the X axis is B( - ![]() ,0)
,0)
Plotting the points on the graph: fig. 6a
Now consider the inequality y≤3x + 2
Here we need the y value less than or equal to 3x + 2
⇒ the required region is below point A.
Therefore the graph of the inequation y≤3x + 2 is fig. 5b
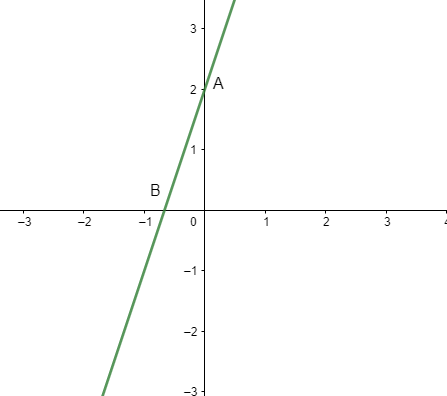
Fig 6a
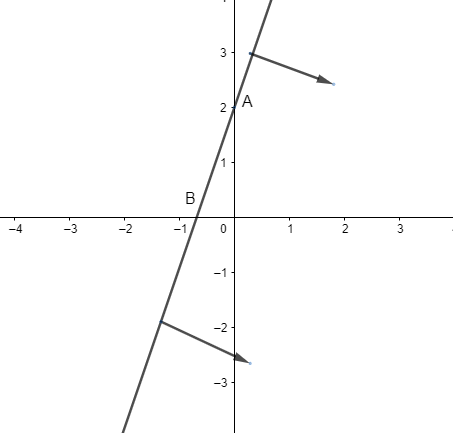
Fig 6b
1