Carefully read the given data. This pertains to India’s performance in world trade. The recent initiatives of the Government of India, such as ‘Make in India’, ‘Digital India’, ‘Skill India’ and roll out of the Foreign Trade Policy (FTP) 2015-20 has impacted the Indian economy in terms of exports and imports and trade balance.
1. Table 1 shows India’s position in the world’s largest economies. Prepare a trend report on the position of India in the global scenario of international trade from the year 2005-2017.
2. Table 2 represents the data about major trade partners of India in the global trade.
Discuss how business and trade activities help in promoting peace and harmony among nations.
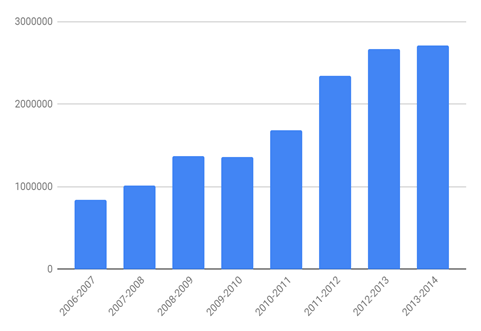
3. Graphically represent (Line Graph or Bar Graph) the status of export and import from the year 2006-2007 to the year 2016-2017 as given in Table 3.
Table 1

Table 2

Table 3

4. Growth rate in Exports and Imports
Table 4

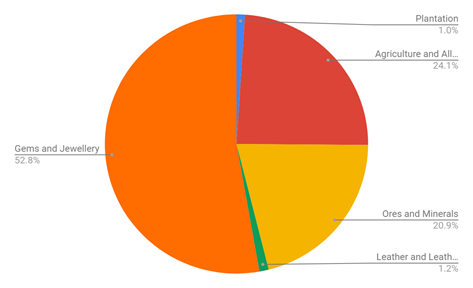
5. Table 5 provides the selected principal commodities, in which India deals at the global level. Prepare a pie-chart of any five commodities of your choice from the given data. You can also go through the annual report 2016-2017 of the Ministry of Commerce and choose commodities other than those given in the Table.
Table 5
S. No. | Commodity | Year | Export (US $) | % Share (US $) | Import | % Share |
1. | Plantation | 2014-2015 2015-2016 2016-2017 (P) (April-October, 2017) | 1503 1563 895 | 1034 895 524 | .58 | 0.25 |
2. | Agriculture and Allied Products | 2014-2015 2015-2016 2016-2017 (P) (April-October, 2017) | 30147 24522 13420 | 19004 20673 12189 | 8.64 | 5.84 |
3. | Ores and Minerals | 2014-2015 2015-2016 2016-2017 (P) (April-October, 2017) | 2410 2015 1412 | 26918 20684 12941 | .91 | 5.08 |
4. | Leather and Leather Manufactures | 2014-2015 2015-2016 2016-2017 (P) (April-October, 2017) | 6195 5554 3158 | 2.03 | 1093 1031 606 | 0.28 |
5. | Gems and Jewellery | 2014-2015 2015-2016 2016-2017 (P) (April-October, 2017 | 41266 39283 26458 | 17.02 | 62351 56509 33845 | 12.80 |
6. | Chemicals and Related Products | 2014-2015 2015-2016 2016-2017 (P) (April-October, 2017) | 31731 32169 18740.56 | 12.06 | 31731 32169 18740 | 12.06 |
7. | Plastic and Rubber | 2014-2015 2015-2016 2016-2017 (P) (April-October, 2017) | 6615 6416 3683 | 2.32 | 6615 6416 3682 | 2.37 |
8. | Electronic Items | 2014-2015 2015-2016 2016-2017 (P) (April-October, 2017) | 6009 5690 3270 | 2.10 | 6009 5690 3270 | 2.10 |
9. | Textile and Allied Products | 2014-2015 2015-2016 2016-2017 (P) (April-October, 2017) | 37141 35953 19593 | 12.61 | 37141 35953 19594 | 12.61 |
10. | Petroleum Crude and Products | 2014-2015 2015-2016 2016-2017 (P)(April-October, 2017) | 56794 30583 19597 |
2. India is one of the biggest countries to have a good share of trade in the global market. It is the 10th largest economy and the second-largest growing economy after China. It has been able to maintain cordial relations with other countries. Business and trade activities among the countries greatly help in the promotion of peace and harmony in the following ways:
a. Business activities can make a positive contribution by bringing people together of different backgrounds.
b. Cooperation among the large multinational companies is extremely important for their success and growth. Different companies often collaborate and create innovative techniques.
c. It helps to provide a strong framework with complete this regard to the religious differences. It helps to empower the marginalized sections of the society with a special focus on women's empowerment.
d. The business which is sensitive to the cultural issues around them make easily accommodate the workplace and also address the difficult social evils of the society.
3. YEAR AND EXPORT
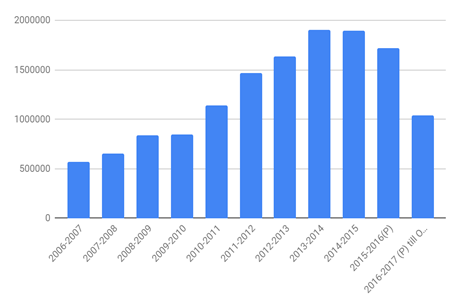
YEAR AND IMPORT
II. The world has changed dynamically in almost all fields. This effect is vastly seen in the international trade business. Nowadays if you wish to purchase something ranging from consumer goods to electronic goods, you can easily go to the nearest shop or a mall to purchase it. But in the earlier days, the situation was very different. The concept of trade has completely changed over time as explained below:
a. In ancient times, if a man wanted to have access to particular good he was restricted to his own town area. If anybody in his town area did not grow or manufacture this good he was unable to purchase it.
b. The people either had to growth for manufacture the item themselves or travel long distances to have access to the same.
c. Most of the people did not have access to travel or any other means to get good, their basket of goods was limited.
d. After the first Civilization, the concept of trade was introduced. A boon for the humans that brought different cultures together.
e. Mesopotamia and Egypt began the concept of producing everything that a person wanted to begin to reduce. The people could now exchange good for good at the local market.
f. Large cities also began to develop on the basis of the natural resources as well as the man-made resources. Only a few middlemen were willing to travel long distances for the goods.
g. The first long-distance trade was around 3000 BC between Mesopotamia and the Indus valley in Pakistan.
h. The trade occurred only in luxurious goods like spices and precious metals.
i. Eventually, the concept of trade spread over entire Europe and Asia.
j. China traded in spices and Silk. Britain traded in the tin. Cyprus earned by exporting its copper resources. Egypt traded its papyrus and wool.
k. Since they were no proper roads, trade expanded through the sea.
l. The most important sea route where the Nile, the Tigris, and the Euphrates.
m. With the domestication of Camels, trade expanded between the Mediterranean and the Indian.
III. a. Make in India campaign is a new campaign launched by the Prime Minister of India Narendra Modi.
b.It is an initiative run by the government of India to give foreign investors a chance to invest in India as well as increase the rate of employment in the country.
c. It was launched by the prime minister on the 25th of September in 2014 at Vigyan Bhawan in New Delhi.
d. It has a large scope expanding to various sectors of the economy in the country.
e. It mainly focuses upon 24 sectors which need to develop through such reforms.
f. The responsibility of Designing this program was given to a Marketing firm called Wieden and Kennedy.
g. This program facilitates foreign direct investment and encourages India and foreign companies to manufacture the goods in India.
h. This would help to increase demand and Employment.
i. It will attract foreign currency to be invested in the Indian industrial sectors.
j. The 24 sectors were the program is expanded to are: Automobiles, railways, pharmaceutical, tourism and hospitality, mining, thermal power, space and astronomy, leather, oil and gas, information technology and business process management, electronics, defense manufacturing, wellness, garments and textile industry, aviation, construction, electrical machinery, roads and highways, chemicals, entertainment and media, automobile component, biotechnology, food processing.