Read the section on weather in any newspaper, preferably, one having a map showing a satellite picture. Mark the area of cloudiness. Attempt to infer the atmospheric circulation from the distribution of clouds. Compare the forecast given in the newspaper with the TV coverage, if you have access to TV. Estimate, how many days in a week was the forecast were accurate.
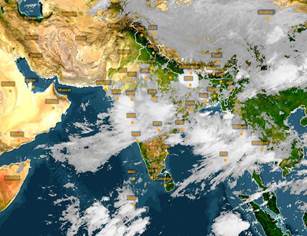
This satellite image shows the cloudiness over the Peninsula on 29th June, 2019.
The clouds extend from north-east to south-west direction, indicating the south-west monsoons that prevail over the subcontinent during June-July.
TV forecasts are generally real-time forecasts, which talk about impending cyclones, hurricanes and wind-storms- they warn people regarding these disasters and ask them to evacuate their houses. This happens alongside marked predictions, which is similar to the role played by newspapers.
I compared the forecasts on online platforms with the true weather conditions. There was a high degree of accuracy in the forecast, with greater accuracy in predicting rainfall than measuring temperatures. With advanced satellite technologies, it is easier to predict the incoming winds, and consequently we can detect the precipitation figures with greater precision.