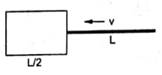
Figure shows an imaginary cube of edge L/2. A uniformly charged rod of length L moves towards left at a small but constant speed v. At t = 0, the left end just touches the centre of the face of the cube opposite it. Which of the graphs shown in figure represents the flux of the electric field through the cube as the rod goes through it?
Graph d
According to Gauss’ law,
We know, Electric flux = E.ds = q/ϵ0,
Where
q = total charge enclosed by the surface,
ϵ0 = electric permittivity of vacuum.
Now at t=0, the left end just touches the centre of the face of the cube opposite the left face.
Initially, charge inside the cube = 0.
Hence, the graph starts from the origin.
Now when the rod is introduced inside, the charge inside the cube slowly increases linearly, since the length of the rod going inside the cube increases, and qinside = ƛl, where ƛ = linear charge density of the rod, and l = length of rod inside the cube. This indicates the rise in the graph.
When a length of L/2 is inside the cube, that is its maximum length is filled, then the charge inside the cube is maximum, which will be L/2 times the total charge carried by the rod.
As long as the inside of the cube stays filled with a portion of length L/2, the flux remains constant, indicating the horizontal line in the graph.
Now when the length of the rod inside slowly keeps decreasing as the rod moves out of the, the charge inside it slowly decreases which also leads to a linear decrease in the flux.
Hence, the graph is completed with the straight line with negative slope until the flux becomes 0(rod is completely out of the cube).