Which of the following plots may represent the thermal energy produced in a resistor in a given time as a function of the electric current?
|
When current passes through a resistor, the heat produced by Joule’s heating effect is given by-
![]()
where,
I =current
R = resistance of the resistor
t = time for which current is flowing
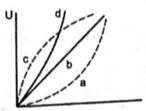
The graph shows the variation of the heat generated by the resistor with respect to the current.
Form the above equation, we get
![]()
Which is same as the equation of parabola.
Since, heat produced for a given time in a resistor varies with the square of current flowing through it.
Thus, the curve a is the correct option.
1