Plot the v-t graph for the following data and state the nature of motion the body:
We simply plot the points on the graph containing
X axis as Time
Y axis as Velocity
Velocity v-s time graph of given data is
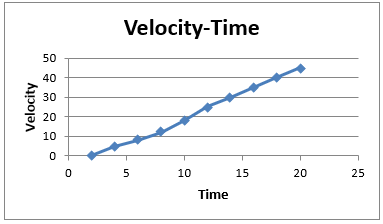
Deduction: We can easily see that the change in velocity per unit time is not constant. In other words velocity time graph is not a straight line, hence the motion is Non Uniformly Accelerated motion.
1