Let i0 be the thermionic current from a metal surface when the absolute temperature of the surface is T0. The temperature is slowly increased and the thermionic current is measured as a function of temperature. Which of the following plots may represent the variation in (i/i0) against (T/T0)?
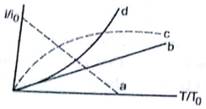
We know that current in thermionic emission varies to square of Temperature. of cathode with exponential term
![]()
The best suited curve from the figures which satisfy the equation is the parabolic one.
1