A graph of volume of hydrogen released vs time for the reaction between zinc and dil. HCl is given in Fig. 4.2. On the basis of this mark the correct option.
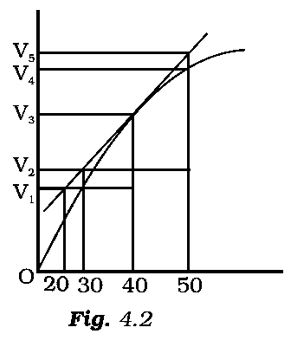
The graph is a straight line till V3 or at t=40 we know the equation of a line.
y=mx + c, where m is the slope which can be determined by using the equation.
![]() where (x1,y1),(x2,y2) are point on line,
where (x1,y1),(x2,y2) are point on line,
For the above graph x1=0,x2=40,y1=0 and y2=V3 .
Putting these values in the above equation we get slope V3/40.
The average rate is equal to the slope of the graph hence V3/40.
Thus option (iii) is correct.
1