Which sample, A or B shown in Fig. 13.2 has shorter mean-life?
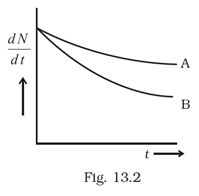
The mean life of B is shorter than that of A
According to the Radioactive Decay Law or Rutherford Soddy Law the decay rate of a nucleus is given by the formula of
![]() ,
,
where
![]() is the rate of decay of the nucleus with respect to time,
is the rate of decay of the nucleus with respect to time, ![]() is the decay rate constant of the nucleus and N is the number of nuclei present in the sample. As shown in the graph the X axis the decay rate and Y axis is the time of decay, now to point the decay rate constant in the graph we have to draw a slope on the curve of sample A and B like this
is the decay rate constant of the nucleus and N is the number of nuclei present in the sample. As shown in the graph the X axis the decay rate and Y axis is the time of decay, now to point the decay rate constant in the graph we have to draw a slope on the curve of sample A and B like this
![]()
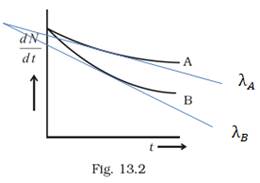
The slope of A and B curve dedicates the decay rate constant of the sample A and B respectively. Now as for the mean life of the samples, the mean life formula is
![]()
where
![]() is the mean life and
is the mean life and ![]() is the decay rate constant. So according to the diagram the mean life of A and B are given as
is the decay rate constant. So according to the diagram the mean life of A and B are given as
![]() ;
; ![]()
![]()
![]()
Now as we can see in the above diagram (in the explanation), the value of decay rate constant of B and A is ![]() (the flatter the curve the lesser is the slope therefore, the value of the slope of B is greater than A as the curve of B is greater than A) respectively. Hence, due to inverse proportionality the value of mean live of B is lesser than that of A. Therefore, the mean life of B is shorter than that of A.
(the flatter the curve the lesser is the slope therefore, the value of the slope of B is greater than A as the curve of B is greater than A) respectively. Hence, due to inverse proportionality the value of mean live of B is lesser than that of A. Therefore, the mean life of B is shorter than that of A.