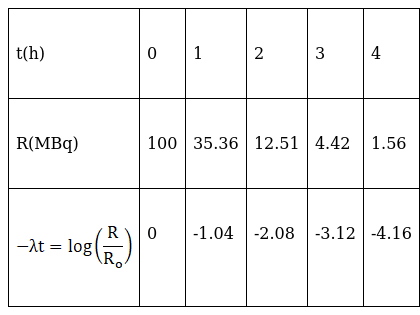
The activity R of an unknown radioactive nuclide is measured at hourly intervals. The results found are tabulated as follows:
(i) Plot the graph of R versus t and calculate half-life from the graph.
(ii) Plot the graph of  versus t and obtain the value of half-life from the graph.
(i) The half-life is ![]() .
.
(ii) ![]()
Explanation
(i) The activity of an unknown radioactive nuclide is measured and given as
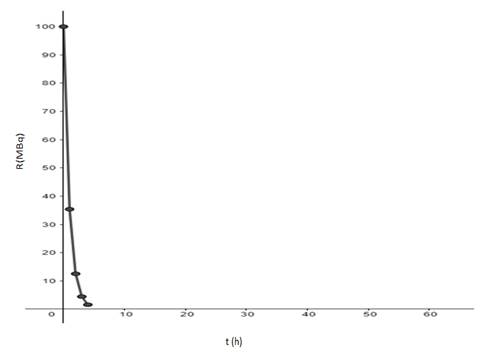
Plotting the point of radioactivity against time, the radioactivity is reduced to 50% of its initial value in less than an hour, to be precise at ![]()
Therefore, the half-life is ![]() .
.
(ii) To find the value of second graph is graph plotted against radioactive decay constant and time t. The plotting points are
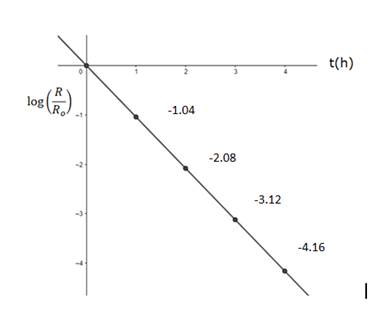
Plotting the product of radioactive decay with time against time taken to decay, the slope which the radioactive decay constant = ![]() .
.
Take any two consequitive point in the graph to find the value of the radioactive decay constant.
![]()
Placing the value of ![]() to find the value of half-life of unknown nucleid is
to find the value of half-life of unknown nucleid is
![]()