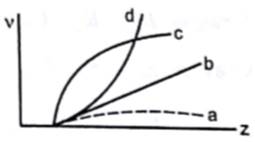
Frequencies of Kα X-rays of different materials are measured. Which one of the graphs in figure may represent the relation between the frequency v and the atomic number Z.
Moseley’s equation is given by:
![]()
![]()
where, “a” represents the proportionality constant while “b” represents the screening constant and Z is the atomic number of the element.
Squaring both sides, we get
So the graph should resemble a parabola (y=x2)
1