The acceleration of a cart started at t = 0, varies with time as shown in figure (3-E2). Find the distance travelled in
30 seconds and draw the position-time graph.
Let u be the initial velocity, v be the final velocity
In the first 10 s,
Distance travelled,
![]()
![]()
At t= 10 s
v=u + at = 0+5×10 = 50 ft
From 10s to 20s, the particle moves with a uniform velocity of 50 ft/s
Distance covered from t=10 s to t=20 s,
S2 = vt = 50×10 = 500 ft
Acceleration is constant between 20s and 30s.i.e -5 ft/m2
At 20 s velocity is 50 ft/s
t=30-20=10 s
Distance,![]()
![]()
Total distance travelled in 30 s is,
![]()
Position –time graph
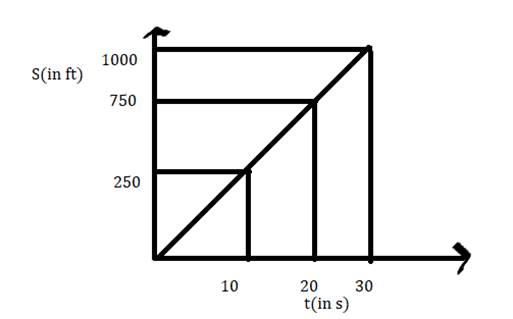
1