Figure (3-E4) shows the graph of the
x-coordinate of a particle going along the X-axis as a function of time. Find (a) the average velocity during O to 10 s,
(b) instantaneous velocity at 2, 5, 8 and 12s.
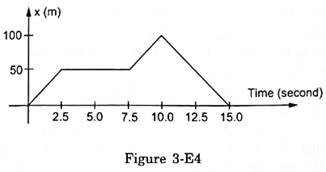
a. Here displacement from t=0 to t=10 s is 100 m
![]()
b. Slope of the x-t graph gives velocity,
At t= 2.5 s,![]() i.e. 20 m/s
i.e. 20 m/s
At t= 5 s,![]() i.e. 0 m/s
i.e. 0 m/s
At t= 8 s,![]() i.e. 20 m/s
i.e. 20 m/s
At t= 12 s,![]() i.e. -20 m/s
i.e. -20 m/s
1