A block is placed on a rough floor and a horizontal force F is applied on it. The force of friction f by the floor on the block is measured for different values of F and a graph is plotted between them.
The given below is the graph plotted between the applied force and the frictional force.
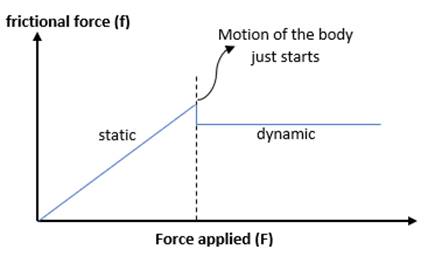
Option (A) is not correct because the slope of graph is 45 degree till the point where motion of the body begins. After that point, the straight line is parallel to x-axis.
Option (B) is not correct because the straight line is parallel to F-axis after the body starts moving. Before that point, the straight line was making 45-degree angle with F-axis.
Option (C) is correct as it is shown in the graph. The frictional force first increases with increase of force applied and then it becomes constant when body starts moving.
Option (D) is correct because there is a kink in the graph at the point where the body just starts moving.