Draw an ogive by less than method for the following data:
No. of rooms: | 1 | 2 | 3 | 4 | 5 | 6 | 7 | 8 | 9 | 10 |
No. of houses: | 4 | 9 | 22 | 28 | 24 | 12 | 8 | 6 | 5 | 2 |
We first prepare the cumulative frequency distribution by less than method as given below:
No. of rooms | No. of houses | Cumulative frequency |
Less than or equal to 1 | 4 | 4 |
Less than or equal to 2 | 9 | 13 |
Less than or equal to 3 | 22 | 35 |
Less than or equal to 4 | 28 | 63 |
Less than or equal to 5 | 24 | 87 |
Less than or equal to 6 | 12 | 99 |
Less than or equal to 7 | 8 | 107 |
Less than or equal to 8 | 6 | 113 |
Less than or equal to 9 | 5 | 118 |
Less than or equal to 10 | 2 | 120 |
Now we mark the upper class limits along x-axis and cumulative frequency along y-axis. Thus, we plot the points (1,4); (2,13); (3,35); (4,63); (5,87); (6,99); (7,107); (8,113); (9,118); (10,120)
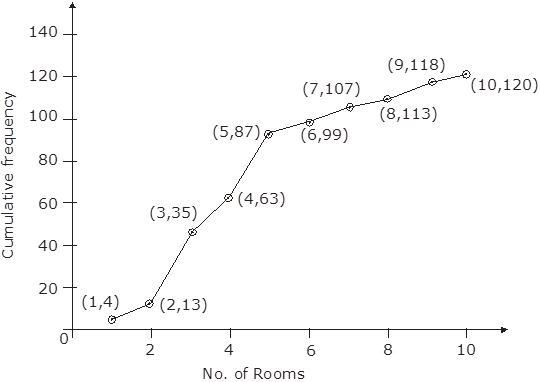
1