The marks scored by 750 students in an examination are given in the form of a frequency distribution table:
Marks | No. of Students |
600-400 | 16 |
640-680 | 45 |
680-720 | 156 |
720-760 | 284 |
760-800 | 172 |
800-840 | 59 |
840-880 | 18 |
Prepare a cumulative frequency table by less than method and draw an ogive.
We first prepare the cumulative frequency distribution by less than method as given below:
Marks | No. of students | Marks less than | Cumulative frequency |
600-640 | 16 | 640 | 16 |
640-680 | 45 | 680 | 61 |
680-720 | 156 | 720 | 217 |
720-760 | 284 | 760 | 501 |
760-800 | 172 | 800 | 673 |
800-840 | 59 | 840 | 732 |
840-880 | 18 | 880 | 750 |
Now we mark the upper class limits along x-axis and cumulative frequency along y-axis. Thus, we plot the points: (640,16); (680,61); (720,217); (760,501); (800,673); (840,732); (880,750)
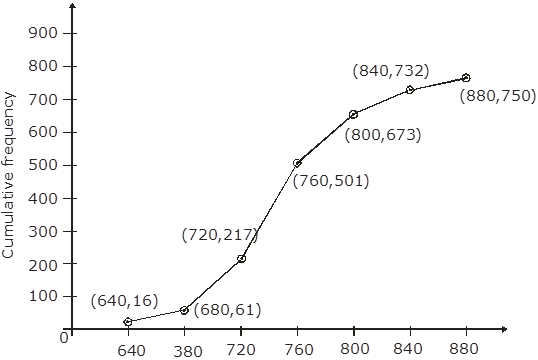
2