Draw an ogive to represent the following frequency distribution:
Class-interval: | 0-4 | 5-9 | 10-14 | 15-19 | 20-24 |
No. of students: | 2 | 6 | 10 | 5 | 3 |
The given frequency of distribution is not continuous. So, we first make it continuous and prepare cumulative frequency distribution as under:
Class interval | No. of students | Less than | Cumulative frequency |
0.5-4.5 | 2 | 4.5 | 2 |
4.5-9.5 | 6 | 9.5 | 8 |
9.5-14.5 | 10 | 14.5 | 18 |
14.5-19.5 | 5 | 19.5 | 23 |
19.5-24.5 | 3 | 24.5 | 26 |
Now we mark the upper class limits along x-axis and cumulative frequency along y-axis. Thus, we plot the points: (4,5,2); (9,5,8); (14,5,18); (19,5,23); (24,5,26)
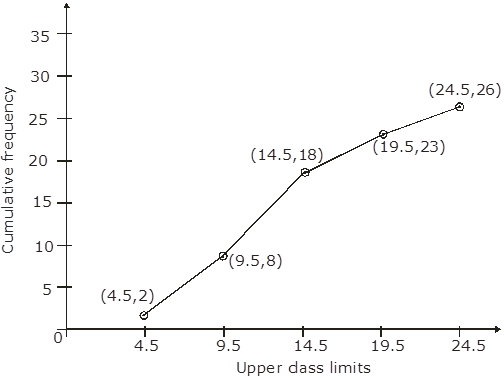
3