The following table gives the height of trees:
Height | No. of trees |
Less than 7 | 26 |
Less than 14 | 57 |
Less than 21 | 92 |
Less than 28 | 134 |
Less than 35 | 216 |
Less than 42 | 287 |
Less than 49 | 341 |
Less than 56 | 360 |
Draw ‘less than’ ogive and ‘more than’ ogive.
Less than method, it is given that:
Height | No. of trees |
Less than 7 | 26 |
Less than 14 | 57 |
Less than 21 | 92 |
Less than 28 | 134 |
Less than 35 | 216 |
Less than 42 | 287 |
Less than 49 | 341 |
Less than 56 | 360 |
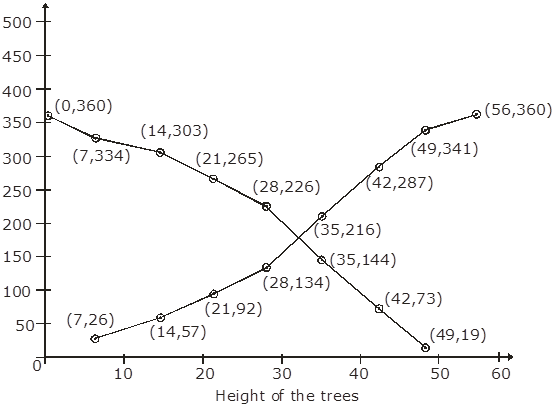
Now we mark the upper class limits along x-axis and cumulative frequency along y-axis. Thus, we plot the points: (7,26); (14,57); (21,92); (28,134); (35,216); (42,287); (49,341); (56,360)
More than method: We will prepare the cumulative frequency table by more than method as given below:
Height | Frequency | Height more than | Cumulative frequency |
0-7 | 26 | 0 | 360 |
7-14 | 31 | 7 | 334 |
14-21 | 35 | 14 | 303 |
21-28 | 42 | 21 | 263 |
28-35 | 82 | 28 | 226 |
35-42 | 71 | 35 | 144 |
42-49 | 54 | 42 | 73 |
49-56 | 19 | 49 | 19 |
Now we mark,
On x-axis lower class limit and on y-axis Cumulative frequency
Thus, we plot graph as (0,360); (7,334); (14,303); (21,263); (28,226); (35,144); (42,73); (49,19)