The annual profits earned by 30 shops of a shopping complex in a locality give rise to the following distribution:
Profit (in lakhs in Rs.) | Number of shops (frequency) |
More than or equal to 5 | 30 |
More than or equal to 10 | 28 |
More than or equal to 15 | 16 |
More than or equal to 20 | 14 |
More than or equal to 25 | 10 |
More than or equal to 30 | 7 |
More than or equal to 35 | 3 |
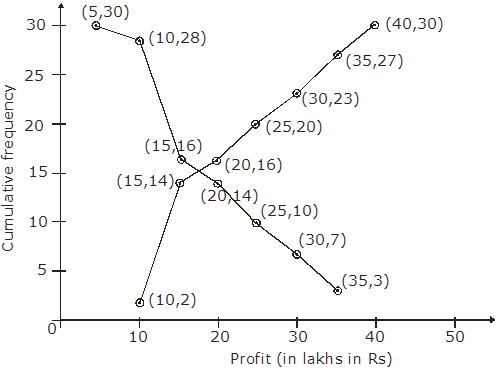
Draw both ogives for the above data and hence obtain the median.
More than method:
Profit (in lakhs in Rs.) | No. of shops (Frequency) |
More than or equal to 5 | 30 |
More than or equal to 10 | 28 |
More than or equal to 15 | 16 |
More than or equal to 20 | 14 |
More than or equal to 25 | 10 |
More than or equal to 30 | 7 |
More than or equal to 35 | 3 |
Now we mark,
On x-axis lower class limit and on y-axis Cumulative frequency
Thus, we plot graph as: (5,30); (10,28); (15,16); (20,14); (25,10); (30,7); (35,3)
Less than method:
Profit (in lakhs in Rs.) | No. of shops (Frequency) | Profit in less than | Cumulative frequency |
0-10 | 2 | 10 | 2 |
10-15 | 12 | 15 | 14 |
15-20 | 2 | 20 | 16 |
20-25 | 4 | 25 | 20 |
25-30 | 3 | 30 | 23 |
30-35 | 4 | 35 | 27 |
35-40 | 3 | 40 | 30 |
Now we mark the upper class limit on x-axis and the cumulative frequency on y-axis. Thus, we plot the points: (10,2); (15,14); (20,16); (25,20); (30,23); (35,27); (40,30)