The following distribution gives the daily income of 50 workers of a factory:
Daily income (in Rs.): | 100-120 | 120-140 | 140-160 | 160-180 | 180-200 |
Number of workers: | 12 | 14 | 8 | 6 | 10 |
Convert the above distribution to a less than type cumulative frequency distribution and draw its ogive.
We first prepare cumulative frequency table by less than method as given below:
Daily income (in Rs.) | Cumulative frequency |
Less than 120 | 12 |
Less than 140 | 26 |
Less than 160 | 34 |
Less than 180 | 40 |
Less than 200 | 50 |
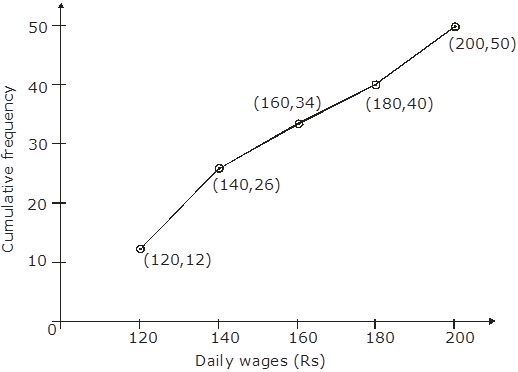
Now we mark on x-axis upper class limit and on y-axis cumulative frequency. Thus, we plot the points: (120, 12); (140,26); (160,34); (180,40); (200,50)
7