The following table gives production yield per hectare of wheat of 100 farms of a village:
Number of farms: | 50-55 | 55-60 | 60-65 | 65-70 | 70-75 | 75-80 in kg per hectare |
Number of farms: | 2 | 8 | 12 | 24 | 38 | 16 |
Draw ‘less than’ ogive and ‘more than’ ogive.
Production yield kg per hectare | Cumulative frequency |
More than or equal to 50 | 100 |
More than or equal to 55 | 98 |
More than or equal to 60 | 90 |
More than or equal to 65 | 78 |
More than or equal to 70 | 54 |
More than or equal to 75 | 16 |
Less than method:
Production yield (in kg/hectare) | No. of farms | Less than | Cumulative frequency |
50-55 | 2 | 55 | 2 |
55-60 | 8 | 60 | 10 |
60-65 | 12 | 65 | 22 |
65-70 | 24 | 70 | 46 |
70-75 | 38 | 75 | 84 |
75-80 | 16 | 80 | 100 |
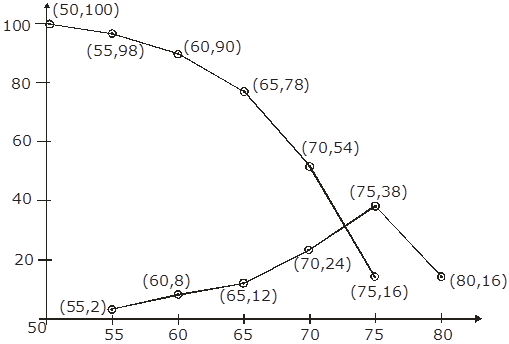
Now on x-axis upper class limits and on y-axis cumulative frequency, we plot the points: (55,2); (60,10) ;(65,22); (70,46); (75,84); (80,100)
More than method:
Production yield (in kg/hectare) | No. of farms | More than | Cumulative frequency |
50-55 | 2 | 50 | 100 |
55-60 | 8 | 55 | 98 |
60-65 | 12 | 60 | 90 |
65-70 | 24 | 65 | 78 |
70-75 | 38 | 70 | 54 |
75-80 | 16 | 75 | 16 |
Now, Mark on x-axis lower class limit and on y-axis cumulative frequency. We plot the points: (50,100); (55,98); (60,90); (65,78); (70,54); (75,16)