During the medical check-up of 35 students of a class, their weights were recorded as follows:
Weight (in kg) | Number of students |
Less than 38 | 0 |
Less than 40 | 3 |
Less than 42 | 5 |
Less than 44 | 9 |
Less than 46 | 14 |
Less than 48 | 28 |
Less than 50 | 32 |
Less than 52 | 35 |
Draw a less than type ogive for the given data. Hence, obtain the median weight from the graph and verify the result by using the formula.
Less than method:
It is given that on x-axis upper class limit and on y-axis cumulative frequency. We plot the points: (38,0); (40,3); (42,5); (49,9); (46,14); (48,28); (50,32); (52,35)
More than method:
Weight (in kg) | No. of students | More than | Cumulative frequency |
38-40 | 3 | 38 | 35 |
40-42 | 2 | 40 | 32 |
42-44 | 4 | 42 | 30 |
44-46 | 5 | 44 | 26 |
46-48 | 14 | 46 | 21 |
48-50 | 4 | 48 | 7 |
50-52 | 3 | 50 | 3 |
X -axis lower class limit and y-axis cumulative frequency, we plot the points: (38,35); (40,32); (42,30); (44,26); (46,21); (48,7); (50,3)
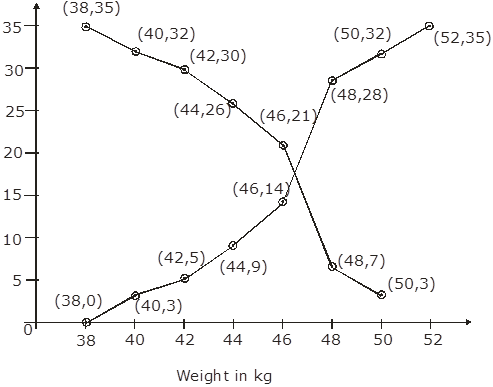
We find the two types of cumulative frequency curves intersect at point P.
The value of M is 46.5 kg
Verification,
We have
Weight (in kg) | No. of students | Cumulative frequency |
36-38 | 0 | 0 |
38-40 | 3 | 3 |
40-42 | 2 | 5 |
42-44 | 4 | 9 |
44-46 | 5 | 14 |
46-48 | 14 | 28 |
48-50 | 4 | 32 |
50-52 | 3 | 35 |
Now, N = 35
Therefore, ![]() =
= ![]() = 17.5
= 17.5
The cumulative frequency is just greater than ![]() is 28 and the corresponding classes 46-48
is 28 and the corresponding classes 46-48
Thus, 46-48 is the median class such that,
l = 46, f = 14, C1 = 14 and h = 2
Median = l + ![]() * h
* h
= 46 + ![]() * 2
* 2
= 46 + ![]() = 46 + 0.5
= 46 + 0.5
= 46.5 kg
Hence, verified.