Read the bar graph given in Fig. 23.17 and answer the following questions:
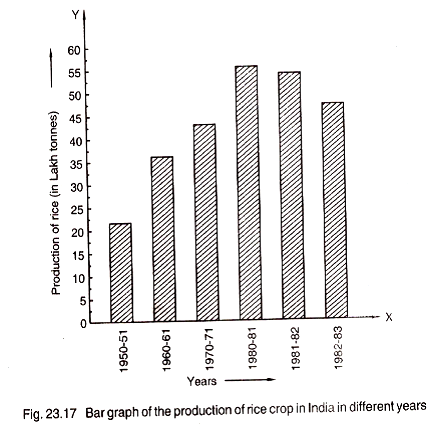
(i) What information is given by the bar graph?
(ii) What was the crop-production of rice in 1970-71?
(iii) What is the difference between the maximum and minimum production of rice?
(i) It gives information regarding the production of rice crop in India in different years.
(ii) The crop production of rice in 1970-71 = 42.5 lakh tonnes.
(iii) The difference between the maximum and minimum production of rice = 55 – 22
= 33 lakh tonnes
13