Read the bar graph given in Fig. 23.19 and answer the following questions :
(i) What information is given by the bar graph?
(ii) In which years the areas under the sugarcane crop were the maximum and the minimum?
(iii) State whether true or false:
The area under the sugarcane crop in the year 192-3 is three times that of the year 1950-51.
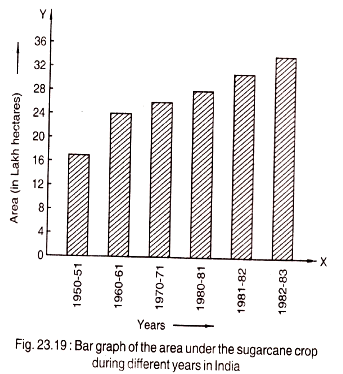
(i) It gives the information about the areas under sugarcane crop during different years in India.
(ii) The areas under the sugarcane crops were the maximum and minimum in 1982-83 and 1950-51 respectively.
(iii) The area under sugarcane crop in the year 1982-83 = 34 lakh hectares.
Area under sugarcane crop in the year 1950-51 = 17 lakh hectares.
Clearly, the area under sugarcane crop in the year 1982-83 is not 3 times that of the year 1950-51.
So, the given statement is false.