Read the bar graph given in Fig. 23.20 and answer the following questions:
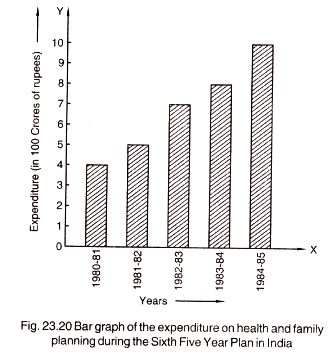
(i) What information is given by the bar graph?
(ii) What was the expenditure on health and family planning in the year 1982-83?
(iii) In which year is the increase in expenditure maximum over the expenditure in previous year? What is the maximum increase?
(i) It gives the information about the expenditure on health and family planning during 6th five year plan in India.
(ii) The expenditure on health and family planning in the year 1982-83 = rs. 700 crores
(iii) 1984-85 is the year in which the increase in expenditure was maximum over the expenditure in the previous year.
The maximum increase = 1000 – 780
= 220 crores
16