The following bar graph shows the results of an annual examination in a secondary school.
Read the bar graph (Fig. 23.28) and choose the correct alternative in each of the following:
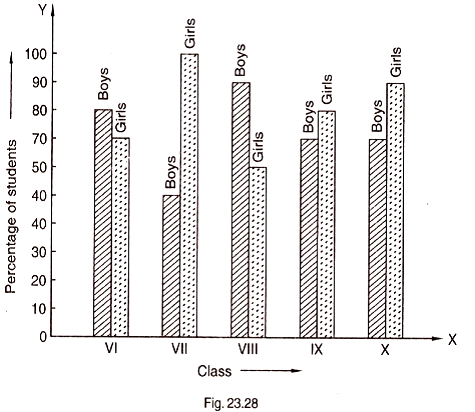
(i) The pair of classes in which the results of boys and girls are inversely proportional are :
(a) VI, VIII (b) VI, IX
(c) VIII, IX (d) VIII, X
(ii) The class having the lowest failure rate of girls is
(a) VII (b) X
(c) IX (d) VIII
(iii) The class having the lowest pass rate of students is
(a) VI (b) VII
(c) VIII (d) IX
(i) (b) VI, IX
(ii) (a) VII
(iii) (b) VII
3