The time taken, in seconds, to solve a problem by each of 25 pupiles is as follows:
16, 20, 26, 27, 28, 30, 33, 37, 38, 40, 42, 43, 46, 46, 46, 48, 49, 50, 53, 58, 59, 60, 64, 52, 20
(a) Construct a frequency distribution for these data, using a class interval of 10 seconds.
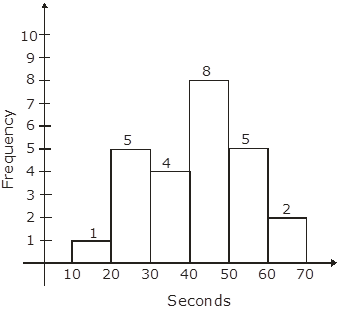
(b) Draw a histogram to represent the frequency distribution.
Seconds | Frequency |
10-20 | 1 |
20-30 | 5 |
30-40 | 4 |
40-50 | 8 |
50-60 | 5 |
60-70 | 2 |
3