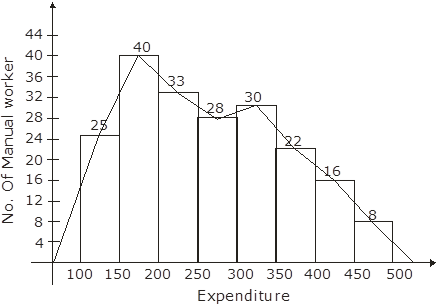
The following is the distribution of total household expenditure (in Rs.) of manual worker in a city:
Expenditure (in Rs.) | 100-150 | 150-200 | 200-250 | 250-300 | 300-350 | 350-400 | 400-450 | 450-500 |
No. of manual worker | 25 | 40 | 33 | 28 | 30 | 22 | 16 | 8 |
Draw a histogram and a frequency polygon representing the above data.
5