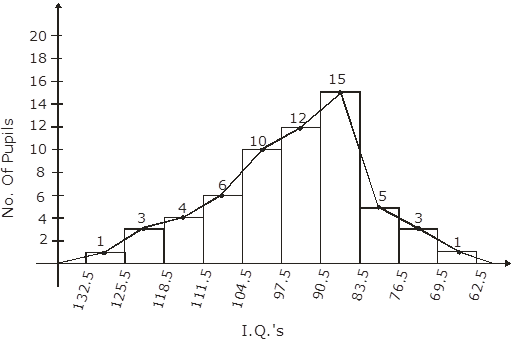
The following table gives the distribution of IQ’s (intelligence quotients) of 60 pupils of class V in a school.
IQ’s | 125.5 To 132.5 | 118.5 To 125.5 | 111.5 To 118.5 | 104.5 To 111.5 | 97.5 To 104.5 | 90.5 To 97.5 | 83.5 To 90.5 | 76.5 To 83.5 | 69.5 To 76.5 | 62.5 To 69.5 |
No. of pupils | 1 | 3 | 4 | 6 | 10 | 12 | 15 | 5 | 3 | 1 |
Draw a frequency polygon for the above data.
6