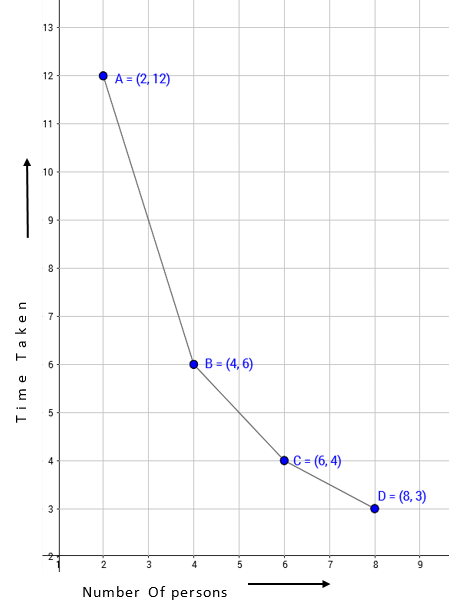
The following table gives the information regarding the number of persons employed to a piece of work and time taken to complete the work:
Number of persons: | 2 | 4 | 6 | 8 |
Time taken (in days): | 12 | 6 | 4 | 3 |
Plot a graph of this information.
Here, we take the number of persons on the x-axis and time taken on the y-axis.
Let us choose the following scale:
On x-axis: 1 cm = 1 person
On y-axis: 1 cm = 1 day
Now, let us plot (2, 12), (4, 6), (6, 4), (8, 3). These points are joined to get the graph representing the given information as shown in the figure below.
Scale:
On x axis: 1cm = 1 person
On y-axis: 1 cm = 1 day
3