Draw the temperature-time graph in each of the following cases:
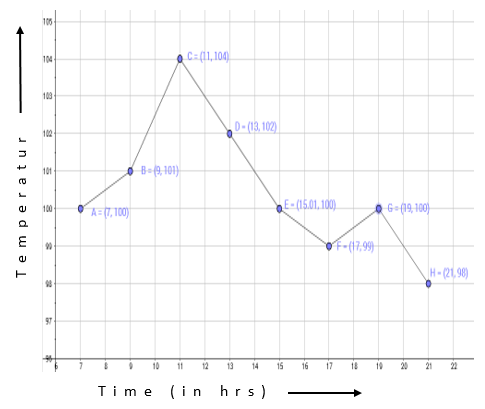
(i)
Time (in hours) | 7:00 | 9:00 | 11:00 | 13:00 | 15:00 | 17.00 | 19:00 | 21:00 |
Temperature (°F) in | 100 | 101 | 104 | 102 | 100 | 99 | 100 | 98 |
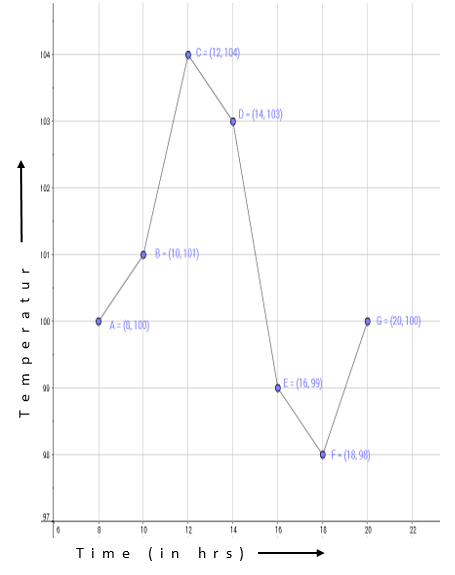
(ii)
Time (in hours) | 8:00 | 10:00 | 12:00 | 14:00 | 16:00 | 18:00 | 20:00 |
Temperature (°F) in | 100 | 101 | 104 | 103 | 99 | 98 | 100 |
(i) Here, we take time on the x-axis and temperature on the y-axis.
Let us choose the following scale:
On x-axis: 1 cm = 1 hour
On y-axis: 1 cm = 1 °F
Now, let us plot the given points. These points are joined to get the graphs representing the given information as shown in the figures below.
Scale:
On x axis: 1cm = 1 hour
On y-axis: 1 cm = 1 °F
(ii) Here, we take time on the x-axis and temperature on the y-axis.
Let us choose the following scale:
On x-axis: 1 cm = 2 hour
On y-axis: 1 cm = 1 °F
Now, let us plot the given points. These points are joined to get the graphs representing the given information as shown in the figures below.
Scale:
On x axis: 1cm = 2 hour
On y-axis: 1 cm = 1 °F