Draw the velocity-time graph from the following data :
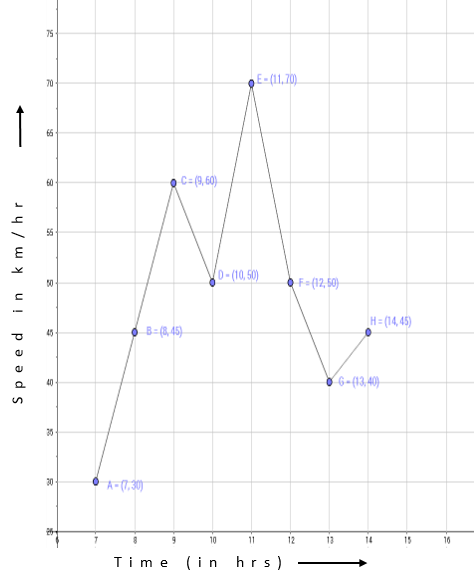
Time (in hours) | 7:00 | 8:00 | 9:00 | 10:00 | 11:00 | 12.00 | 13:00 | 14:00 |
Speed (in km/hr) | 30 | 45 | 60 | 50 | 70 | 50 | 40 | 45 |
Here, we take time on the x-axis and speed on the y-axis.
Let us choose the following scale:
On x-axis: 1 cm = 1 hour
On y-axis: 1 cm= 5 km/hr
Now, let us plot (7:00,30), (8:00,45), (9:00,60), (10:00,50), (11:00,70), (12:00,50), (13:00,40), (14:00,45). These points are joined to get the graph representing the given information as shown in the figure below.
Scale:
On x axis: 1cm = 1 hour
On y-axis: 1 cm = 5 km/hr
7