The runs scored by two teams A and B in first 10 overs are given below :
Overs | I | II | III | IV | V | VI | VII | VIII | IX | X |
Team A : | 2 | 1 | 8 | 9 | 4 | 5 | 6 | 10 | 6 | 2 |
Team B : | 5 | 6 | 2 | 10 | 5 | 6 | 3 | 4 | 8 | 10 |
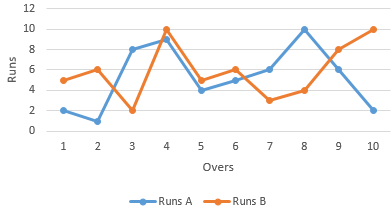
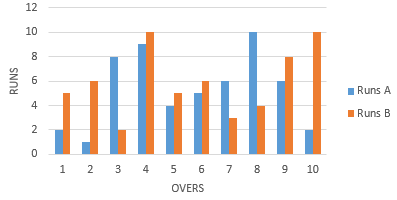
Draw a graph depicting the data, making the graphs on the same axes in each case in two different ways as a graph and as a bar chart.
we take overs on x-axis and runs on y-axis.
Let us choose the following scale:
On x-axis: 1 cm = 1 over
On y-axis: 1 cm = 2 run
Now, let us plot given points for team A and for team B. These points are joined to get the graph representing the given information as shown in the figure below.
Now we plot bar graph
9