Represent the following data by a pie diagram:
Items of expenditure | Expenditure | |
Family A | Family B | |
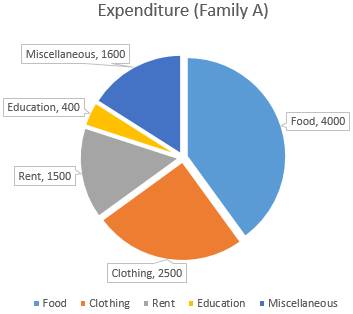
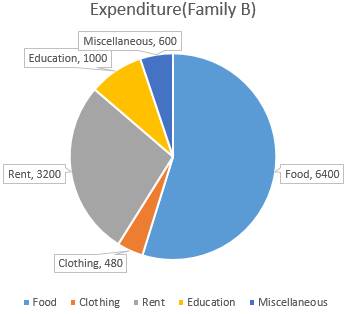
Food Clothing Rent Education Miscellaneous | 4000 2500 1500 400 1600 | 6400 480 3200 1000 600 |
Total | 10000 | 11680 |
Here the total expenditure of family A = 10000 and family B = 11680
So,
The central angle for family A = ![]() × 360°
× 360°
The central angle for family B = ![]() × 360°
× 360°
Hence, the central angle for each activity will be calculated as follows
Item | Expenditure (Family A) | Sector angle (degree) (Family A) | Expenditure | Sector angle (degree) |
Food | 4000 | 4000/10000 × 360 = 144 | 6400 | 6400/11680 × 360 = 197.3 |
Clothing | 2500 | 2500/10000 × 360 = 90 | 480 | 480/11680 × 360 = 14.8 |
Rent | 1500 | 1500/10000 × 360 = 54 | 3200 | 3200/11680 × 360 = 98.6 |
Education | 400 | 400/10000 × 360 = 14.4 | 1000 | 1000/11680 × 360 = 30.8 |
Miscellaneous | 1600 | 1600/10000 × 360 = 57.6 | 600 | 600/11680 × 360 = 18.5 |
Steps for construction of representation of data in pie chart
Step 1: Draw the circle of appropriate radius.
Step 2 : Choose a radius anywhere inside the circle.
Step 3 : Now draw a sector of calculated component’s central angle. It is always preferable to choose component with largest central angle first and then continue in descending order of magnitude of their central angle.
Step 4: After drawing sectors, shade them with different colours and label them as shown in the figure.