Given below is the frequency distribution of the heights of 50 students of a class:
Class interval: | 140-145 | 145-150 | 150-155 | 155-160 | 160-165 |
Frequency: | 8 | 12 | 18 | 10 | 5 |
Draw a histogram representing the above data.
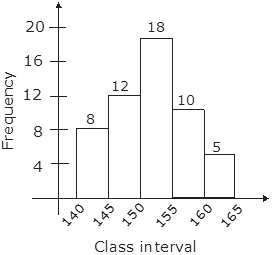
We have drowned the histogram by using the class-interval and frequency given in the question. The hight of the rectangle in the histogram shows the frequencies of class intervals.
1