Draw a histogram of the following data:
Class interval: | 10-15 | 15-20 | 20-25 | 25-30 | 30-35 | 35-40 |
Frequency: | 30 | 98 | 80 | 58 | 29 | 50 |
By drawing class interval at ‘x’ axis and frequency at ‘y’ axis.
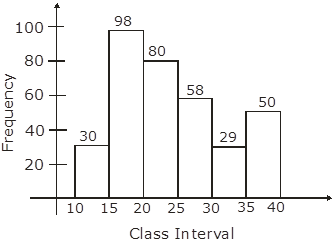
We have drowned the histogram by using the class-interval and frequency given in the question.
2