In a hypothetical sample of 20 people the amounts of money with them were found to be as follows:
114, 108, 100, 98, 101, 109, 117, 119, 126, 131, 136, 143, 156, 168, 182, 195, 207, 219, 235, 118.
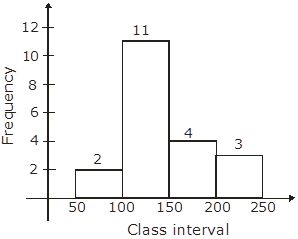
Draw the histogram of the frequency distribution (taking one of the class intervals as 50-100).
Class interval | Frequency |
50 – 100 | 2 |
100 – 150 | 11 |
150 – 200 | 4 |
200 – 250 | 3 |
By drawing class interval on ‘x’ axis and frequency on ‘y’ axis. The height of histogram shows the frequency for particular class interval.
4